
SCHEDULE 14A
(Rule 14a-101)
INFORMATION REQUIRED IN PROXY STATEMENT
SCHEDULE 14A INFORMATION
Proxy Statement Pursuant to Section 14(a) of the
Securities Exchange Act of 1934
Filed by the Registrant x Filed by a Party other than the Registrant ¨
Check the appropriate box:
| ¨ | Preliminary Proxy Statement | |||
| ¨ | Confidential, for Use of the Commission Only (as permitted by Rule 14a-6(e)(2)) | |||
| x | Definitive Proxy Statement | |||
| ¨ | Definitive Additional Materials | |||
| ¨ | Soliciting Material Pursuant Rule 14a-12 | |||
NORDSON CORPORATION | ||||
| (Name of Registrant as Specified in Its Charter) | ||||
| (Name of Person(s) Filing Proxy Statement, if other than the Registrant) | ||||
| Payment of Filing Fee (Check the appropriate box): | ||||
| x | No fee required. | |||
| ¨ | Fee computed on table below per Exchange Act Rules 14a-6(i)(1) and 0-11. | |||
| (1) | Title of each class of securities to which transaction applies:
Not Applicable | |||
| ||||
| (2) | Aggregate number of securities to which transaction applies:
Not Applicable | |||
| ||||
| (3) | Per unit price or other underlying value of transaction computed pursuant to Exchange Act Rule 0-11 (Set forth the amount on which the filing fee is calculated and state how it was determined):
Not Applicable | |||
| ||||
| (4) | Proposed maximum aggregate value of transaction:
Not Applicable | |||
| ||||
| (5) | Total fee paid: | |||
| Not Applicable | ||||
| ||||
| ¨ | Fee paid previously with preliminary materials. | |||
| ¨ | Check box if any part of the fee is offset as provided by Exchange Act Rule 0-11(a)(2) and identify the filing for which the offsetting fee was paid previously. Identify the previous filing by registration statement number, or the Form or Schedule and the date of its filing. | |||
| (1) | Amount Previously Paid:
Not Applicable | |||
| ||||
| (2) | Form, Schedule or Registration Statement No.:
Not Applicable | |||
| ||||
| (3) | Filing Party:
Not Applicable | |||
| ||||
| (4) | Date Filed:
Not Applicable | |||
| ||||
NORDSON CORPORATION
Notice of 20122014
Annual Meeting
and Proxy Statement

28601 Clemens Road
Westlake, Ohio 44145
January 23, 201217, 2014
It is my pleasure, on behalf of your Board of Directors, to invite you to attend our Annual Meeting of Shareholders, which will be held this year at the Atlanta Marriott Alpharetta, 5750 Windward Parkway, Alpharetta, Georgia 30005,Nordson Corporation’s Headquarters, 28601 Clemens Road, Westlake, Ohio 44145 at 8:00 a.m. on Tuesday, February 28, 2012 at 8:30 a.m.25, 2014.
The accompanying Notice of Annual Meeting of Shareholders and Proxy Statement describe the items of business that will be discussed and voted upon during the meeting. It is important that you vote your shares of common stock whether or not you plan to attend the meeting. You have a choice of voting through the Internet, by telephone or by returning the enclosed proxy/voting instruction card by mail. You may also vote in person at the meeting. Please refer to the instructions in the enclosed materials. If you attend the meeting and wish to vote in person, the ballot you submit at the meeting will supersede your proxy.
We look forward to providing you a reportyour attending the Annual Meeting and, on Fiscal Year 2011 and the first quarter of Fiscal Year 2012 which ends January 31, 2012. On behalf of management and our Board of Directors, I want to thank you for your continued support and confidence in 2012.2014.
Sincerely,
JOSEPH P. KEITHLEY
Chairman of the Board of Directors
OF SHAREHOLDERS
To Be Held Tuesday, February 28, 201225, 2014
Date and Time: | Tuesday, February 25, 2014, at 8:00 a.m. | |
Place: | Nordson Corporation’s Headquarters, 28601 Clemens Road, Westlake, Ohio 44145. | |
Items of Business: | 1. To elect as directors three nominees, named in the Proxy Statement and recommended by the Board of Directors, to serve until the 2017 Annual Meeting of Shareholders and until their successors shall have been duly elected and qualified; 2. To ratify the appointment of Ernst & Young LLP as our independent registered public accounting firm for the fiscal year ending October 31, 2014; 3. To cast an advisory vote to approve named executive officer compensation; and 4. To transact such other business as may properly come before the meeting or any adjournment or postponement thereof. | |
Record Date: | Close of business on December 27, 2013. | |
A Proxy Statement, Proxy/Voting Instruction Card, and Annual Report to Shareholders, which includes our Annual Report on Form 10-K for the fiscal year ended October 31, 2013, accompany this Notice and are also available at:www.nordson.com/investors. The Board of Directors has determined that our shareholders of record at the close of business on December 27, 2013 are entitled to notice of, and to vote at, the Annual Meeting of Shareholders.
By Order of the Board of Directors,
ROBERT E. VEILLETTE
Vice President, General Counsel
and Secretary
Westlake, Ohio
January 17, 2014
1
This summary highlights information contained elsewhere in this Proxy Statement and in our Annual Report on Form 10-K. For more complete information about these topics, please review the complete Proxy Statement and Annual Report on Form 10-K. This summary does not contain all of the information that you should consider, and you should read the entire Proxy Statement carefully before voting.
GENERAL INFORMATION
| 2014 Annual Meeting Time and Date | 8:00 a.m. Tuesday, February 25, 2014 | |
| Place | Nordson Corporation Headquarters 28601 Clemens Road Westlake, Ohio 44145 USA | |
| Items of Business/Proposals | 1. To elect as directors three nominees, named in the Proxy Statement and recommended by the Board of Directors to serve until the 2017 Annual Meeting of Shareholders and until their successors shall have been duly elected and qualified; 2. To ratify the appointment of Ernst & Young LLP as our independent registered public accounting firm for the fiscal year ending October 31, 2014; 3. To cast an advisory vote to approve named executive officer compensation; and 4. To transact such other business as may properly come before the meeting or any adjournment or postponement thereof. | |
| Record Date | Close of business December 27, 2013 | |
| Voting | Shareholders as of the record date are entitled to vote. Each share of common stock is entitled to one vote for the election of directors and one vote for each of the proposals to be voted on. |
VOTING MATTERS AND RECOMMENDATIONS
| Voting Matter | Board Recommendation | |
Election as Directors Nominees: Keithley, Merriman, and Puma | FOR EACH NOMINEE | |
| Ratification of Ernst & Young as Independent Registered Public Accounting Firm for fiscal year ending October 31, 2014 | FOR | |
Advisory Vote to Approve Named Executive Officer Compensation | FOR |
GOVERNANCE HIGHLIGHTS
The following table summarizes our Board structure and key elements of our corporate governance framework:
| Governance Element | Comments | |
| Board Independence | Eight of our nine directors are independent under the Company’s Governance Guidelines and NASDAQ listing standards. All members of the Audit Committee, the Compensation Committee and the Governance and Nominating Committee are independent. | |
| Independent Directors Meetings | Our independent directors meet in executive sessions after each regular board meeting without management present. | |
| Board Leadership Structure | Our Board is led by an independent Chairman, Joseph P. Keithley. | |
| Board Structure | Classified with three classes of directors. | |
| Voting Standard for Election of Directors | Plurality in uncontested elections. |
2
| Governance Element | Comments | |
| Stock Ownership Guidelines | To align director and executive officer interests with those of our shareholders, we have stock ownership guidelines for directors and executive officers. Each of the directors and executive officers satisfies the stock ownership guidelines or is within the grace period provided by the stock ownership guidelines to achieve compliance. | |
| Board Self-Assessments | Each year, the Governance and Nominating Committee of the Board of Directors administers self-assessments of the Board of Directors and its committees. | |
| Chief Executive Officer Evaluation | Each year the Board of Directors as a whole evaluates the performance of the Chief Executive Officer. | |
| Hedging/Pledging Transactions Prohibited | We have an insider trading policy that prohibits pledging, short sales and hedging of shares of our Common Stock by directors and executive officers. | |
| Performance-Based Compensation | We rely heavily on performance-based compensation for executive officers, including awards of performance-based stock. | |
| Clawback Policy | Our Board of Directors may require reimbursement of incentive compensation and/or equity awarded to an executive officer if we are required to restate all or a portion of our financial statements or the Compensation Committee determines that an executive officer has engaged in (i) conduct that violates our Code of Ethics and Business Conduct, or (ii) willful misconduct or fraud that causes harm to the Company. | |
| Advisory Vote on Executive Compensation | We conduct an annual shareholder advisory vote on compensation we pay to our named executive officers. | |
| Shareholder Rights Plan (“Poison Pill”) | We do not have a shareholders rights plan in place. | |
| Oversight of Risk | The Board as a whole exercises its oversight responsibilities with respect to material risks we face in a global market, including operational, financial, strategic, competitive, reputational, legal and regulatory risks. The Board has delegated responsibility for the oversight of specific risks to Board committees. | |
| Shareholder Proposals under Rule 14a-8 | Shareholder proposals for consideration for inclusion in our 2015 proxy statement pursuant to Rule 14a-8 of the Securities Exchange Act of 1934 must be delivered to us by September 13, 2014. | |
| Proposals and Director Nominations Submitted Pursuant to our Regulations | Notice of shareholder proposals and director nominees for consideration at our 2015 Annual Meeting of Shareholders, must be received by us no earlier than November 26, 2014 and no later than December 26, 2014. |
Fiscal year 2013 was a year of solid financial results for the Company in the face of a lackluster global economic recovery. Our ability to execute on all facets of the 2013 operating plan is reflected in the following benchmarks achieved:
| Operational Element | Comment | |
Revenue | Grew to a record $1.54 billion, an increase of 9.5% from a year ago | |
Gross Margin | 56% | |
Operating profit/margin | $324 million/21% | |
Net income | $222 million | |
Earnings Per Share | $3.42 | |
Return on Capital | 17.6% | |
Quarterly Dividend | $0.18 (increase of 20%) | |
Share Repurchase | Over the last three years we purchased 7.8% of Nordson’s outstanding shares at an average price of $47.16 per share, a discount of approximately 34.6% compared to the 2013 year-end closing price of $72.09 per share. | |
1-Year TSR | 23% |
3
Fiscal year 2013 compensation of our named executive officers is described in the Compensation Discussion and Analysis in this Proxy Statement. The table below highlights compensation paid to our named executive officers. It does not include all of the information provided in the Summary Compensation Table presented later in this Proxy Statement. Additional information about our compensation philosophy and program, including compensation determinations for each of our named executive officers, can be found in the Compensation Discussion and Analysis in this Proxy Statement.
| Pay Component | Comments | |
| Base Salary | • Base salary increases for the named executive officers ranged from 3.1% to 6.7%. | |
| Annual Cash Incentive | • As a percentage of target, awards were in the range of 69% - 100% for the named executive officers. • We exceeded the maximum performance measure for the return on capital metric of the annual cash incentive plan, but did not meet threshold level for the EPS performance measure. | |
Long-Term Incentive | • Consistent with prior years’ practices, the Compensation Committee approved performance share grants based on a thorough review of competitive market data, individual and Company performance, and management’s recommendations. • Value mix: 40% stock options, 40% performance shares, and 20% restricted shares. • The fiscal year 2011 - 2013 performance period incentive plan payout was 200% of target based on performance confirmed by the Compensation Committee at the completion of the performance period. Our cumulative revenue was $4,185,658,000 and cumulative EPS was $10.12, both exceeding the maximum performance measure. | |
| Chief Executive Officer’s Total Direct Compensation | • Base Salary - $775,000 (6.9% increase over 2012) • Annual cash incentive award - $775,000 (at target - 100% of base salary). • Long-term incentives: g Stock Options - $1,051,974 ($24.46 per share - grant date fair value) g Restricted Shares - $492,720 ($61.59 per share - grant date fair value) g Performance Shares - $953,440 at target ($59.59 per share - grant date fair value) • Total: $4,048,134 |
4
NORDSON CORPORATION
FOR THE ANNUAL MEETING OF SHAREHOLDERS
FEBRUARY 25, 2014
The accompanying proxy is solicited on behalf of the Board of Directors (“Board”) of Nordson Corporation for use at the 2014 Annual Meeting of Shareholders of Nordson Corporation(“Annual Meeting”). The Annual Meeting will be held this year at the Atlanta Marriott Alpharetta, 5750 Windward Parkway, Alpharetta, Georgia 30005,Nordson Corporation’s Headquarters, 28601 Clemens Road, Westlake, Ohio 44145 at 8:00 a.m. on Tuesday, February 28, 2012, at 8:30 a.m.25, 2014 for the following purposes:
| 1. | To elect as directors three nominees, named in the Proxy Statement and recommended by the Board of Directors, to serve until the |
|
|
|
and
A Proxy Statement, Proxy/Voting Instruction Card, and Annual Report to Shareholders, which includes our Annual Report on Form 10-K for the Fiscal Year ended October 31, 2011, accompany this Notice. The Board of Directors has determined that our shareholders of record at the close of business on January 3, 2012 are entitled to notice of, and to vote at, the Annual Meeting of Shareholders.
By Order of the Board of Directors,
ROBERT E. VEILLETTE
Vice President, General Counsel
and Secretary
Westlake, Ohio
January 23, 2012
PROXY STATEMENT
FOR THE ANNUAL MEETING OF SHAREHOLDERS
FEBRUARY 28, 2012
The accompanying proxy is solicited on behalf of the Board of Directors (“Board”) of Nordson Corporation for use at the 2012 Annual Meeting of Shareholders (“Annual Meeting”). The Annual Meeting will be held at the Atlanta Marriott Alpharetta, 5750 Windward Parkway, Alpharetta, Georgia 30005, Tuesday, February 28, 2012, at 8:30 a.m. for the following purposes:
| 2. | To ratify the appointment of Ernst & Young LLP as our independent registered public accounting firm for the |
| 3. | To cast an advisory vote |
| 4. | To transact such other business as may properly come before the meeting or any adjournment or postponement thereof. |
This Proxy Statement and the accompanying proxy/voting instruction card were first mailed to shareholders on or about January 23, 2012.17, 2014. Our 20112013 Annual Report to Shareholders is enclosed with this Proxy Statement.
This Proxy Statement contains important information regarding our Annual Meeting, the proposals on which you are being asked to vote, information you may find useful in determining how to vote, and information about voting procedures. As used herein, “we,” “us,” “our,” “Nordson” or the “Company” refers to Nordson Corporation.
Important Notice Regarding the Availability of Proxy Materials for the Annual
Meeting of Shareholders to be held on February 28, 2012:25, 2014:
The Proxy Statement, proxy/voting instruction card and the Annual Report to Shareholders, which includes our Annual Report on Form 10-K for the Fiscal Yearfiscal year ended October 31, 20112013, are available on our website at: www.nordson.com/investors.
25
QUESTIONS AND ANSWERS ABOUT THE ANNUAL MEETING AND THESE PROXY MATERIALS
Why am I receiving this Proxy Statement?You have been sent this Proxy Statement and proxy/voting instruction card(s) because you were a shareholder, or held Nordson common stock through a broker, bank or other third party, at the close of business on January 3, 2012,December 27, 2013, the record date for shareholders entitled to vote at the Annual Meeting. As of December 27, 2013, there were outstanding, excluding treasury shares which cannot be voted, 64,300,002 common shares entitled to one vote per share upon all matters presented to the shareholders.
What is a proxy? A proxy is your legal appointment of another person to vote the shares that you own in accordance with your instructions. The person you appoint to vote your shares is also called a proxy.
On the proxy/voting instruction card, you will find the names of the persons designated by the Company to act as proxies to vote your shares at the Annual Meeting. The proxies are required to vote your shares in the manner you instruct.
What is the record date for voting at the Annual Meeting? The record date for the 2012 Annual Meeting of Shareholders is January 3, 2012.
Who can attend the Annual Meeting? All shareholders of record as of the close of business on January 3, 2012December 27, 2013 may attend the meeting.
What proposals may I vote on at the Annual Meeting and how does the Board recommend I vote? The following matters will be voted on at the Annual Meeting:
# | Proposal | Board Recommendation | ||
1 | FOR ALL NOMINEES | |||
2 | Ratification of the appointment of Ernst & Young LLP as our independent registered public accounting firm for | FOR | ||
3 | FOR |
Will any other matters be voted on? We are not aware of any other matters on which you will be asked to vote at the Annual Meeting. If other matters are properly brought before the Annual Meeting, the proxy holders will use their discretion to vote on these matters as they may arise. Furthermore, if a nominee cannot or will not serve as director, then the proxy holders will vote for a replacement nominated by the Board. We do not expect any nominee to be unwilling to serve.
Who may vote? ShareholdersWhat is the difference between holding shares as a shareholder of record, a beneficial owner or a Nordson-sponsored retirement plan participant?
| • | Shareholder of record. If your shares are registered in your name with our transfer agent, Computershare Limited, you are considered the shareholder of record and these proxy materials have been sent directly to you. You may vote in person at the meeting. You may also grant us your proxy to vote your shares by telephone, via the Internet, or by mailing your signed proxy/voting instruction card in the postage-paid envelope provided. The card provides voting instructions. |
| • | Beneficial owner. If your shares are not held in your name but instead are held in a brokerage account, by a trustee, or by another nominee, then that other entity/holder is considered the shareholder of record and you are considered a beneficial owner of those shares. We sent these proxy materials to that other entity/holder, and they have been forwarded to you with a voting instruction card. As the beneficial owner, you have the right to direct your broker, trustee, or other nominee how to vote. Please refer to the information your broker, trustee, or other nominee provided to determine what voting options are available to you. |
6
| • | Shares held as a plan participant in the Nordson Corporation Employees’ Savings Trust (“401(k)”) Plan and/or Nordson Corporation Employee Stock Ownership Plan (collectively, the “Plans”). If you participate in one or both of these Plans you may have certain voting rights regarding shares of our common stock credited to your account in the Plans. You do not own these shares. They are owned by the Plan trustee. |
The Plans provide you with voting rights based on the number of shares that were constructively invested in your Plan account as of the close of business on January 3, 2012the record date. You may vote these shares in much the same way as shareholders of record vote their shares, but you have an earlier deadline.
You may vote the amount of shares credited to your account as of the record date for the Annual Meeting by telephone, via the internet, or by mailing your signed proxy/voting instruction card in the postage-paid envelope provided. Your vote must be received by the Plan trustee by11:59 p.m. Eastern Time February 20, 2014. You may vote these shares by following the instructions provided on the proxy/voting instruction card included with those materials.
By submitting voting instructions, you will direct the Plan trustee:
How to vote the shares allocated to your account in the Plan(s); and
How to vote a portion of the shares allocated to the accounts of other participants in the Plan(s) who have not submitted voting instructions by the deadline.
The trustee will submit one proxy to vote all shares in each of the Plans. The trustee will vote the shares of participants submitting voting instructions in accordance with their instructions and will vote the remaining shares in each of the Plans in the same proportion as the final votes of all participants who actually voted. Please note that, if you do not submit voting instructions for the shares in your account by the voting deadline, those shares will be included with the other undirected shares and voted by the trustee as described above. Because the trustee submits one proxy to vote all shares in the Plan, you may not vote Plan shares in person at the annual meeting.
How do I vote and what are the voting deadlines?
Shareholders of record and Plan participants. If you are a shareholder of record or a Plan participant, you may vote by proxy in any of the following three ways:
1.By telephone. If you reside in the United States or Canada, you may call1-800-690-6903, 24 hours a day, 7 days a week. Have your proxy/voting instruction card in hand when you call and follow the voice prompts to cast your vote.
2.Via the Internet. You may access the website atwww.proxyvote.com to cast your vote 24 hours a day, 7 days a week. With your proxy/voting instruction card in hand, follow the instructions provided to cast your vote.
3.By mail. You may mark, sign and date your proxy/voting instruction card and return it in the enclosed prepaid and addressed envelope. You do not need to mail the proxy/voting instruction card if you have voted by telephone or over the Internet.
The Internet and telephone voting procedures are designed to authenticate votes cast and allow shareholders to appoint a proxy and to confirm that their actions have been properly recorded. Specific voting instructions are set forth on the accompanying proxy/voting instruction card.
If you are a shareholder of record, your deadline to cast your vote by proxy is11:59 p.m., Eastern Time, on February 24, 2014. You may also vote in person at the Annual Meeting.
If you are a Plan participant, your deadline to cast your vote by proxy is11:59 p.m., Eastern Time, on February 20, 2014.
7
Beneficial Owners. If you are a beneficial owner, you should have received voting instructions from the broker, trustee or other nominee holding your shares. You should follow the instructions in the notice or voting instructions provided by your broker, trustee or nominee in order to instruct your broker, trustee or other nominee on how to vote your shares. The availability of telephone and Internet voting will depend on the voting process of the broker, trustee or nominee. Shares held beneficially may be voted in person at the Annual Meeting only if you obtain a legal proxy from the broker or nominee giving you the right to vote the shares.
All owners. If you receive more than one proxy/voting instruction card, it is important that you vote all shares represented by the multiple cards. Each card represents different shares.
May I change my vote? Yes. You may change your vote or revoke your proxy any time before the voting deadline.
Shareholders of record. If you are a shareholder of record, you may revoke your vote at any time before the final vote at the Annual Meeting by:
submitting a later-dated vote by telephone or via the Internet since only your latest Internet or telephone proxy received by 11:59 p.m., Eastern Time, on February 24, 2014 will be counted;
returning a later-dated, duly executed proxy card;
delivering a written revocation to our Corporate Secretary at 28601 Clemens Road, Westlake, Ohio 44145 before the Annual Meeting; or
| • | attending the Annual Meeting in personand voting again. |
Plan participants. If you are a Plan participant, you may revoke previously given voting instructions on or before February 20, 2014 by filing either a written notice of revocation or a properly completed and signed voting instruction card bearing a later date with New York Life Investment Management, the trustee.
Beneficial owners. If you are a beneficial owner of your shares, you must contact the broker or other nominee holding your shares and follow their instructions for changing your vote.
All owners. You will not revoke a proxy merely by attending the Annual Meeting. To revoke a proxy, you must take one of the actions described above.
What will happen if I do not vote my shares?
Shareholders of record. If you are the shareholder of record and you do not vote by proxy card, by telephone, via the Internet or in person at the Annual Meeting, your shares will not be voted at the Annual Meeting.
Beneficial owners. If you are the beneficial owner of your shares, your broker, trustee or nominee may vote your shares only on those proposals on which it has discretion to vote. AtUnder the rules of the Securities and Exchange Commission (the “SEC”), your broker, trustee or nominee does not have discretion to vote your shares on non-routine matters such as Proposals 1 and 3. Therefore, if you do not provide voting instructions to your broker, trustee or other nominee, your broker or other nominee may only vote your shares on Proposal 2 and any other routine matters properly presented for a vote at the Annual Meeting.
8
What if I do not specify how my shares are to be voted? If you are a shareholder of record and you submit a proxy, but you do not provide voting instructions, your shares will be voted as indicated in the following table:
Proposal | Vote to be Cast | |
| Proposal 1 — Election of three nominees named in the Proxy Statement and recommended by the Board of Directors as directors to serve for a three-year term: Joseph P. Keithley, Michael J. Merriman, Jr., and Mary G. Puma | FOR ALL NOMINEES | |
| Proposal 2 — Ratification of the appointment of Ernst & Young LLP as our independent registered public accounting firm for the fiscal year ending October 31, 2014 | FOR | |
Proposal 3 — Advisory vote to approve named executive officer compensation | FOR |
What constitutes a quorum, and why is a quorum required? Our Regulations require a quorum of shareholders to hold our Annual Meeting. A quorum exists when at least a majority of the outstanding shares entitled to vote at the close of business on the record date there were 65,187,881are represented at the Annual Meeting either in person or by proxy. Your shares will be counted towards the quorum if you submit a proxy or vote at the Annual Meeting. Abstentions and broker non-votes (described below) will also count towards the quorum requirement. If a quorum is not achieved, a majority of the shares present at the Annual Meeting may adjourn the meeting to a later date.
What is a broker non-vote? Brokers or other nominees who hold Nordson common shares for a beneficial owner have the discretion to vote on routine proposals when they have not received voting instructions from the beneficial owner. Your broker is not permitted to vote on your behalf on the election of directors and other non-routine matters unless you provide specific instructions to vote your shares. For your vote to be counted, you need to communicate your voting instructions to your broker, trustee or nominee.
A broker non-vote occurs when a broker or other nominee does not receive voting instructions from the beneficial owner and does not have the discretion to direct the voting of the shares. Broker non-votes will be counted for purposes of calculating whether a quorum is present at the Annual Meeting, but will not be counted for purposes of determining the number of votes with respect to a particular proposal. Thus, a broker non-vote will not impact our ability to obtain a quorum and will not otherwise affect the outcome of the vote on a proposal that requires a plurality of votes cast (Proposal 1) or the approval of Proposal 2 since brokers have discretion to vote uninstructed shares on that proposal. Broker non-votes will affect the outcome of the vote on Proposal 3. It is important that you provide voting instructions for all shares you own beneficially.
What is the vote required for each proposal?
Proposal | Vote Required | Broker Discretionary Voting Permitted | Treatment of Abstentions | |||
| Proposal 1 — Election of three nominees named in the Proxy Statement and recommended by the Board of Directors, as directors to serve for a three-year term: Joseph P. Keithley, Michael J. Merriman, Jr., and Mary G. Puma | Plurality of votes cast | No | Not counted | |||
| Proposal 2 — Ratification of the appointment of Ernst & Young LLP as our independent registered public accounting firm for the fiscal year ending October 31, 2014 | Majority of the shares entitled to vote and present in person or represented by proxy | Yes | Will count as present and entitled to vote; will have the effect of a vote against the proposal | |||
| Proposal 3 — Advisory vote to approve named executive officer compensation | Majority of the shares entitled to vote and present in person or represented by proxy | No | Will count as present and entitled to vote; will have the effect of a vote against the proposal |
9
If cumulative voting is invoked, the proxy holders will vote all proxy cards received by them in such manner in accordance with cumulative voting as will assure the election of as many of our common stock outstandingnominees as possible.
Who will tabulate the votes? Broadridge Financial Solutions, Inc. (“Broadridge”) has been engaged as our independent agent to receive and entitledtabulate shareholder votes. Broadridge will separately tabulate FOR, AGAINST and WITHHOLD votes, abstentions, and broker non-votes. The Inspector of Election will certify the election results and perform any other acts required by Ohio Corporation Law.
What happens if the Annual Meeting is adjourned or postponed? Your proxy will still be effective and will be voted at the rescheduled Annual Meeting. You will still be able to vote. Eachchange or revoke your proxy until it is voted.
Who is paying for the costs of this proxy solicitation? We will bear the expense of soliciting proxies. Proxies may also be solicited by Nordson personnel who will not receive additional compensation for such solicitation. Copies of proxy materials and the Annual Report to Shareholders will be supplied to brokers and other nominees for the purpose of soliciting proxies from beneficial owners.
How will I know the results of the Annual Meeting? The final voting results will be tallied by our Inspector of Election and published in a Current Report on Form 8-K filed with the SEC that we expect to file within four business days of the Annual Meeting.
Delivery of voting materials to shareholders sharing an address. To reduce the expense of delivering duplicate materials to shareholders sharing the same address, we have adopted a procedure approved by the SEC called “householding.” Under this procedure, certain shareholders of record who have the same address and last name will receive only one copy of the Annual Report to Shareholders and proxy materials until such time as one or more of these shareholders notifies us that they wish to receive individual copies. Shareholders of record in the same household continue to receive separate proxy/voting instruction cards.
We will mail materials that you request at no cost. You may contact us with your request by writing to or calling Corporate Communications, Nordson Corporation, 28601 Clemens Road, Westlake, Ohio, 44145 or 440-414-5606. You may also access the Proxy Statement and Annual Report at: www.nordson.com/investors.
How do I submit director nominations or shareholder proposals for the 2015 Annual Meeting?
Shareholder Proposals Submitted Under Rule 14a-8
Assuming that our 2015 Annual Meeting is held within thirty days of the anniversary of the 2014 Annual Meeting, any shareholder who wishes to submit a proposal for consideration at the 2015 Annual Meeting and for inclusion in next year’s proxy statement under Rule 14a-8 of the Securities Exchange Act of 1934, as amended, (the “Exchange Act”) should send the proposal c/o Secretary, Nordson Corporation, 28601 Clemens Road, Westlake, Ohio 44145 for receipt on or before September 13, 2014.
Proposals and Director Nominations Submitted Pursuant to our Regulations
Additionally, under our Regulations, a shareholder may submit a proposal for consideration at the 2015 Annual Meeting, but not for inclusion in next year’s proxy statement, if the shareholder provides written notice no earlier than 90 days and no later than 60 days prior to the 2015 Annual Meeting. Assuming that the 2015 Annual Meeting will be held on February 24, 2015, that means notice of such proposals must be received no earlier than November 26, 2014 and no later than December 26, 2014. Our Regulations are available at: www.nordson.com/governance.
A shareholder may nominate a candidate for election as a director at the 2015 Annual Meeting provided the shareholder (i) is a shareholder of record at the time the shareholder gives notice of the
10
nomination, (ii) is entitled to vote at the meeting in the election of directors, and (iii) has given timely written notice of the nomination to the Secretary. Similar to the timeliness requirements under our Regulations described above, the notice of the nomination must be received no earlier than 90 days and no later than 60 days prior to the meeting. Assuming the 2015 Annual Meeting is held on February 24, 2015, the deadlines would be no earlier than November 26, 2014 and no later than December 26, 2014. The Governance and Nominating Committee will assess the qualifications of the candidate according to criteria set out in Nordson Corporation’s Governance Guidelines, which are available at: www.nordson.com/governance. For a candidate to be considered for election as a director or for business to be properly requested by a shareholder to be brought before an annual meeting of shareholders, the shareholder must comply with all of the requirements of our Regulations, not just the timeliness requirements described above. Any proposal for inclusion in the proxy materials, notice of proposal, or suggestion for nominee(s) for election to our Board of Directors should be sent to c/o Secretary, Nordson Corporation, 28601 Clemens Road, Westlake, Ohio 44145.
If the notices delivered pursuant to the Regulations are not timely received, then we will not be required to present such proposals or nominations, as applicable, at the 2015 Annual Meeting. If the Board chooses to present any information submitted after the deadlines set forth in the Regulations (other than pursuant to Rule 14a-8 of the Exchange Act) at the 2015 Annual Meeting, then the persons named in proxies solicited by the Board for the 2015 Annual Meeting may exercise discretionary voting power with respect to such information.
YOUR VOTE IS VERY IMPORTANT, SO PLEASE VOTE.
Promptly return your proxy/voting instruction card or vote via telephone or the Internet,
which will help to reduce the cost of this solicitation.
This Proxy Statement and the enclosed proxy/voting instruction card are being mailed to shareholders of record on or about January 17, 2014. Nordson’s executive offices are located at 28601 Clemens Road, Westlake, Ohio 44145, telephone number (440) 892-1580.
PROPOSAL 1: ELECTION OF DIRECTORS WHOSE TERMS EXPIRE IN 2017
The Governance and Nominating Committee is responsible for identifying and evaluating nominees for director and for recommending to the Board a slate of nominees for election at the Annual Meeting. The Governance and Nominating Committee has recommended to the Board, and the Board has approved, the persons named as nominees for terms expiring in 2017 and, unless otherwise marked, a proxy will be voted for such nominees. Messrs. Keithley and Merriman and Ms. Puma currently serve as directors. All nominees have agreed to stand for election for a three-year term.
In considering each director nominee and the composition of the Board of Directors as a whole, the Governance and Nominating Committee utilizes a diverse group of experiences, qualifications, attributes and skills, including diversity in gender, ethnicity and race, which the Governance and Nominating Committee believes enables a director nominee to make significant contributions to the Board, Nordson and our shareholders. Depending upon the skill sets being sought for a particular vacancy or addition to the Board, the following experiences have been included in our search criteria:
Active or recently retired chief executive officer, leading a sophisticated, business-to-business industrial enterprise ranging from $400 million to $1 billion plus revenues;
Experience in a company with a material percentage of sales (ideally at least 25 percent) derived from emerging markets;
A demonstrated track record of growing a company/division or supporting that growth through his/her role;
11
Experience in a company composed of multiple business units and having a demonstrated experience in technology and R&D based environments;
A demonstrated concern for society and a view of the role of a corporation in society, which is consistent with the traditional values of Nordson Corporation.
It is intended that proxies that are submitted but do not withhold the authority to vote for any or all of the nominees will be voted for the election as directors of all of the nominees named below. At this time, the Board knows of no reason why any nominee might not be a candidate at the 2014 Annual Meeting. However, in the event any one vote per share.or more of such nominees becomes unavailable for election, proxies will be voted in accordance with the best judgment of the proxy holder.
The name and age of each of the three nominees for election as directors for terms expiring in 2017, as well as present directors whose terms will continue after the meeting, appear below together with his or her principal occupation for at least the past five years, the year each became a director of the Company and certain other information.
Nominees For Terms Expiring in 2017
Name | Age | Business Experience and Directorships for Previous Five Years and Qualifications to Serve | Director Since | |||||||
Joseph P. Keithley | 65 | Business Experience. Mr. Keithley has served as Chairman of the Board of Nordson Corporation since February 2010. He served as Chairman of the Board of Keithley Instruments, Inc., a provider of measurement solutions to the semiconductor, fiber optics, telecommunications and electronics industries from 1991, as well as a member of its Board of Directors from 1986 until December 2010 when Keithley Instruments was purchased by Danaher Corporation. He also served as Keithley Instruments’ Chief Executive Officer from November 1993 to December 2010 and as President from May 1994 to December 2010. | 2001 | |||||||
| Other Directorships in Previous 5 Years. Mr. Keithley previously served as Chairman of the Board of Keithley Instruments. He currently serves as a director of Materion Corporation (NYSE: MTRN), an integrated producer of high performance engineered materials used in a variety of electrical, electronic, thermal and structural applications, and Axcelis Technologies, Inc. (NASDAQ GS: ACLS), a provider of equipment and service solutions for the semiconductor manufacturing industry. | ||||||||||
| Key Attributes, Experiences and Skills. Mr. Keithley brings extensive, broad-based international business and executive management and leadership experience from his leadership roles at Keithley Instruments to his role as Chairman of our Board of Directors. Among other things, Mr. Keithley draws upon his extensive knowledge in the global semiconductor and electronics industries garnered while leading Keithley Instruments. Mr. Keithley also has extensive public company board and governance experience. | ||||||||||
Michael J. Merriman, Jr. | 57 | Business Experience. Mr. Merriman has been an Operating Advisor of Resilience Capital Partners LLC since June 2008. Resilience is a private equity firm focused on principal investing in lower middle market underperforming and turnaround situations. Mr. Merriman is a business consultant for Product Launch Ventures, LLC, a company that he founded in 2004 to pursue consumer product opportunities and provide business advisory services. Mr. Merriman served as President and Chief Executive Officer of The Lamson & Sessions Co., a manufacturer of thermoplastic conduit, fittings and electrical switch and outlet boxes from November 2006 to November 2007. Mr. Merriman | 2008 | |||||||
12
Name | Age | Business Experience and Directorships for Previous Five Years and Qualifications to Serve | Director Since | |||||||
| served as Senior Vice President and Chief Financial Officer of American Greetings Corporation (formerly, NYSE: AM), a designer, manufacturer and seller of greeting cards and other social expression products from September 2005 until November 2006. | ||||||||||
| Other Directorships in Previous 5 Years. Mr. Merriman is presently a director of Regis Corporation (NYSE: RGS), the beauty industry’s global leader in beauty salons, hair restoration centers and cosmetology education, and OMNOVA Solutions Inc. (NYSE: OMN), a technology-based company and an innovator of emulsion polymers, specialty chemicals, and decorative and functional surfaces for a variety of commercial, industrial and residential end uses. Mr. Merriman was a director of American Greetings from 2006 through August 2013 when American Greetings became a private company. Mr. Merriman also served as a director from 2004 until April 2011 for RC2 Corporation, a manufacturer of pre-school toys and infant products. | ||||||||||
| Key Attributes, Experiences and Skills. Mr. Merriman’s prior experience as a public company chief executive officer and chief financial officer and his current service on the boards of directors of two publicly traded companies, as well as his experience at Resilience, provides him with valuable experience and significant knowledge in the areas of executive management, strategy, corporate governance, acquisitions and divestitures, finance and financial reporting, product development expertise, and investor relations. Mr. Merriman has significant finance, financial reporting and accounting expertise and was formerly a certified public accountant, which provides the Board with valuable expertise and qualifies him as a “financial expert” on the Audit Committee, as described under the “Audit Committee” caption in Corporate Governance section of this Proxy Statement. | ||||||||||
Mary G. Puma | 55 | Business Experience. Ms. Puma has served as Chairman of the Board of Axcelis Technologies, Inc. (NASDAQ GS: ACLS) since May 2005 and chief executive officer since January 2002. Axcelis is a provider of equipment and service solutions for the semiconductor manufacturing industry. | 2001 | |||||||
| Other Directorships in Previous 5 Years. Ms. Puma is presently Chairman of the Board of Axcelis Technologies. | ||||||||||
| Key Attributes, Experiences and Skills. Ms. Puma contributes extensive general management experience in an international, technology-driven business and possesses a thorough knowledge of corporate governance and strategy development. Ms. Puma brings valuable experience in compensation and talent management planning matters to our Compensation and Governance & Nominating Committees, respectively. | ||||||||||
Present Directors Whose Terms Expire in 2015
Name | Age | Business Experience and Directorships for Previous Five Years and Qualifications to Serve | Director Since | |||||
Arthur L. George, Jr. | 52 | Business Experience. Mr. George has served as Senior Vice President and Manager, Analog Engineering Operations of Texas Instruments Incorporated (NASDAQ GS: TXN) since 2011. Texas Instruments is one of the world’s largest semiconductor companies and a highly innovative, high performing global leader in analog, embedded processing and wireless technologies.Mr. George was Senior Vice President and Worldwide General Manager, High Performance Analog of Texas Instruments from 2006 to 2011. | 2012 | |||||
13
Name | Age | Business Experience and Directorships for Previous Five Years and Qualifications to Serve | Director Since | |||||
| Key Attributes, Experiences and Skills. Mr. George brings to the Board significant executive general management experience as well as extensive operational and new product development experiences in high technology markets. Mr. George’s experience with High Performance Analog products used in a wide range of industrial products gives him insight on a diverse set of industries and affords the Board a unique perspective in identifying strategic and tactical risks attendant to the semiconductor electronics market. | ||||||||
Frank M. Jaehnert | 56 | Business Experience. Mr. Jaehnert served as Chief Executive Officer and President of Brady Corporation (NYSE: BRC) from April 1, 2003 through October 7, 2013. Brady Corporation is an international manufacturer and marketer of complete solutions that identify and protect premises, products and people. Brady’s core capabilities in manufacturing, channel management, printing systems, precision engineering and materials expertise make it a leading supplier to customers in general manufacturing, maintenance and safety, process industries, construction, electrical, telecommunications, electronics, laboratory/healthcare, airline/transportation, brand protection, education, governmental, public utility, and a variety of other industries. | 2012 | |||||
| Other Directorships in Previous 5 Years. Mr. Jaehnert served as a director of Brady Corporation from April 1, 2003 through October 7, 2013. | ||||||||
| Key Attributes, Experiences and Skills. Mr. Jaehnert brings extensive, broad-based international business and executive management and leadership experience to our Board, and, coupled with a demonstrated execution of strategic vision and a well-developed understanding of accounting and financial matters, compliments strongly the skill sets of our present directors. Mr. Jaehnert’s significant finance, financial reporting and accounting background provides the Board with valuable expertise and qualifies him as a “financial expert” on the Audit Committee, as described under the “Audit Committee” caption in Corporate Governance section of this Proxy Statement. | ||||||||
Present Directors Whose Terms Expire in 2016
Name | Age | Business Experience and Directorships for Previous Five Years and Qualifications to Serve | Director Since | |||||
Lee C. Banks | 50 | Business Experience. Mr. Banks has served as Executive Vice President and Operating Officer of Parker Hannifin Corporation since 2008. Parker Hannifin Corporation (NYSE: PH) is the world’s leading diversified manufacturer of motion and control technologies and systems, providing precision-engineered solutions for a wide variety of mobile, industrial and aerospace markets. Mr. Banks was Senior Vice President and Operating Officer of Parker Hannifin from 2006 to 2008 and served as its Worldwide President, Hydraulics Group, from 2003 to 2006. | 2010 | |||||
| Key Attributes, Experiences and Skills. As a senior executive with a multinational corporation, Mr. Banks provides the Board with significant executive general management and operational experiences and a unique perspective in identifying strategic and tactical risks attendant to a multinational sales, distribution, manufacturing and operational footprint. | ||||||||
14
Name | Age | Business Experience and Directorships for Previous Five Years and Qualifications to Serve | Director Since | |||||
Randolph W. Carson | 62 | Business Experience. From 2000 to February 2009, Mr. Carson served as Chief Executive Officer of Eaton Corporation (NYSE: ETN) Electrical Group. Eaton is a global diversified industrial manufacturer and technology leader in electrical components and systems for power quality, distribution and control. Mr. Carson retired from Eaton in May 2009 following ten years with the company. Prior to Eaton Corporation, Mr. Carson held several executive positions with Rockwell International. | 2009 | |||||
| Other Directorships in Previous 5 Years. Mr. Carson is presently a director of Fairchild Semiconductor Inc. (NYSE: FSC), a leading global manufacturer of semiconductor devices; Graftech International Inc. (NYSE: GTI), a global manufacturer of carbon and graphite products; and the Southwire Company, the leading North American supplier of wire and cable products. | ||||||||
| Key Attributes, Experiences and Skills. Our Board believes that Mr. Carson’s deep operational experience in global industrial businesses enables him to provide unique insight to our Board with respect to meeting marketplace challenges, implementing Lean and other productivity initiatives, integrating business units and anticipating and planning for commercial risk and uncertainties. Together with his experience, strategic vision and understanding of financial accounting and financial matters, our Board believes Mr. Carson is well qualified to serve as a member of our Board. Mr. Carson’s public company board experience contributes to his familiarity with current issues and his ability to identify and address matters that come before the Governance & Nominating and Audit Committees on which he serves. | ||||||||
Michael F. Hilton | 59 | Business Experience. Mr. Hilton became Nordson’s President and Chief Executive Officer effective January 16, 2010. Prior to his joining Nordson, Mr. Hilton was Senior Vice President and General Manager for Air Products and Chemicals, Inc. (NYSE: ADP) from 2007 until 2010 with specific responsibility for leading the company’s $2 billion global Electronics and Performance Materials segment. Air Products and Chemicals serves customers in industrial, energy, technology and healthcare markets worldwide with a unique portfolio of atmospheric gases, process and specialty gases, performance materials, and equipment and services. | 2010 | |||||
| Other Directorships in Previous 5 Years. Mr. Hilton serves as a director of Ryder System, Inc. (NYSE: R), a FORTUNE® 500 provider of leading-edge transportation, logistics and supply chain management solutions. | ||||||||
| Key Attributes, Experiences and Skills. Mr. Hilton is the only member of Nordson’s management serving on the Board. With over 30 years of global manufacturing industry experience, Mr. Hilton brings to the Board an intimate understanding of management leadership, strategy development and day-to-day operations of a multinational company, including product line management, new product technology and talent development, manufacturing, distribution and other sales channels, business processes, international operations and global markets. | ||||||||
Victor L. Richey, Jr. | 56 | Business Experience. Mr. Richey has served as Chairman of the Board, President and Chief Executive Officer of ESCO Technologies, Inc. (NYSE: ESE) since 2003. ESCO Technologies is a diversified manufacturer of special purpose utility solutions for electric, gas and water utilities, including hardware and software to support advanced metering applications and fully automated intelligent instrumentation; and engineered filtration products to the aviation, space and process | 2010 | |||||
15
Name | Age | Business Experience and Directorships for Previous Five Years and Qualifications to Serve | Director Since | |||
| markets worldwide. ESCO Technologies is the industry leader in radio frequency shielding and electromagnetic compatibility test products. | ||||||
| Other Directorships in Previous 5 Years. Mr. Richey is presently Chairman of the Board of ESCO Technologies. | ||||||
| Key Attributes, Experiences and Skills. The Board believes Mr. Richey provides a breadth of skills critical to the Board’s ability to discharge its oversight responsibility. Mr. Richey has extensive experience as Chairman, President and Chief Executive Officer of a diversified global producer and marketer of technology, and he has significant executive management and board experience at public and private companies within some of our end markets, including the semiconductor industry. |
Former director, William L. Robinson, retired from our Board in 2013 pursuant to the Company’s Governance Guidelines which provide that a director is expected to retire from service as a director at the end of the Board meeting that precedes his or her 72nd birthday.
No shareholder or group that beneficially owns 1% or more of our outstanding common shares has recommended a candidate for election as a director at the 2014 Annual Meeting.
Cumulative Voting
Voting for directors will be cumulative if any shareholder provides notice in writing to the President, a Vice President or the Secretary of Nordson of a desire to have cumulative voting. The notice must be received at least 48 hours before the time set for the Annual Meeting, and an announcement of the notice must be made at the beginning of the meeting by the Chairman or the Secretary, or by or on behalf of the shareholder giving the notice. If cumulative voting is in effect, each shareholder will be entitled to cast, in the election of directors, a number of votes equal to the product of the number of directors to be elected multiplied by the number of shares that the shareholder is voting. Shareholders may cast all of these votes for one nominee or distribute them among several nominees, as they see fit. If cumulative voting is in effect, shares represented by each properly submitted proxy will also be voted on a cumulative basis, with the votes distributed among the nominees in accordance with the judgment of the persons named on the proxy/voting instruction card.
3
What is the difference between holding shares as a shareholder of record and as a beneficial owner?
|
|
|
How do I vote and what are the voting deadlines?
Shareholders of Record. If you are a shareholder of record, there are several ways for you to vote your shares:
|
|
|
Beneficial Owners. If you are a beneficial owner of your shares, you should have received voting instructions from the broker, trustee or other nominee holding your shares. You should follow the instructions in the notice or voting instructions provided by your broker, trustee or nominee in order to instruct your broker, trustee or other nominee on how to vote your shares. The availability of telephone and Internet voting will depend on the voting process of the broker, trustee or nominee. Shares held beneficially may be voted in person at the Annual Meeting only if you obtain a legal proxy from the broker or nominee giving you the right to vote the shares.
4
All Owners. If you receive more than one proxy card and/or voting instruction card, it is important that you vote all shares represented by the multiple cards. Each card represents different shares.
May I change my vote? Yes. You may change your vote or revoke your proxy any time before the Annual Meeting.
Shareholders of Record. If you are a shareholder of record, you may revoke your vote at any time before the final vote at the Annual Meeting by:
submitting a later-dated vote by telephone or via the Internet since only your latest Internet or telephone proxy received by 11:59 p.m. Eastern Time on February 27, 2012 will be counted;
returning a later-dated proxy card;
delivering a written revocation to our Corporate Secretary at 28601 Clemens Road, Westlake, Ohio 44145 before the Annual Meeting; or
|
Beneficial Owners. If you are a beneficial owner of your shares, you must contact the broker or other nominee holding your shares and follow their instructions for changing your vote. For 401(k) plan and ESOP shares, you may revoke previously given voting instructions on or before February 23, 2012 by filing either a written notice of revocation or a properly completed and signed voting instruction card bearing a laterTo date, with New York Life Investment Management, the trustee.
What will happen if I do not vote my shares?
Shareholders of Record. If you are the shareholder of record and you do not vote by proxy card, by telephone, via the Internet or in person at the Annual Meeting, your shares will not be voted at the Annual Meeting.
Beneficial Owners. If you are the beneficial owner of your shares, your broker, trustee or nominee may vote your shares only on those proposals on which it has discretion to vote. Under the rules of the Securities and Exchange Commission, your broker, trustee or nominee does not have discretion to vote your shares on non-routine matters such as Proposals 1 and 3. Therefore, if you do not provide voting instructions to your broker, trustee or other nominee, your broker or other nominee may only vote your shares on Proposal 2 and any other routine matters properly presented for a vote at the Annual Meeting.
What if I do not specify how my shares are to be voted? If you are a shareholder of record and you submit a proxy, but you do not provide voting instructions, your shares will be voted as indicated in the following table:
| ||
| ||
|
What constitutes a quorum, and why is a quorum required? Our Regulations require a quorum of shareholders to hold our Annual Meeting. A quorum exists when at least a majority of the outstanding shares entitled to vote at the close of business on the record date (January 3, 2012) are represented at the Annual Meeting either in person or by proxy. Your shares will be counted towards the quorum if you submit a proxy or vote at the Annual Meeting. Abstentions and broker non-votes (described below) will also count towards the quorum requirement. If a quorum is not achieved, a majority of the shares present at the Annual Meeting may adjourn the meeting to a later date.
5
What is the effect of a broker non-vote? Brokers or other nominees who hold Nordson common shares for a beneficial owner have the discretion to vote on routine proposals when theywe have not received voting instructionsa notice from the beneficial owner at least ten days prior to the Annual Meeting. Your broker is not permitted to vote on your behalf on the election of directors and other non-routine matters unless you provide specific instructions by completing and returning the proxy card or following the instructions provided to you by your broker, trustee or nominee to vote your shares via telephone or the Internet. For your vote to be counted, you need to communicate your voting instructions to your broker, trustee or nominee.
A broker non-vote occurs when a broker or other nominee does not receive voting instructions from the beneficial owner and does not have the discretion to direct the voting of the shares. Broker non-votes will be counted for purposes of calculating whether a quorum is present at the Annual Meeting, but will not be counted for purposes of determining the number of votes present in person or represented by proxy and entitled to vote with respect to a particular proposal. Thus, a broker non-vote will not impact our ability to obtain a quorum and will not otherwise affect the outcome of the vote on a proposal that requires a plurality of votes cast (Proposal 1) or the approval of Proposal 2 since brokers have discretion to vote uninstructed shares on that proposal. Broker non-votes will affect the outcome of the vote on Proposal 3. It is important that you provide voting instructions for all shares you own beneficially.
What is the vote required for each proposal?
|
|
| ||
With respect to Proposal 1, you may vote FOR all nominees, WITHHOLD your vote as to all nominees, or vote FOR all nominees except those specific nominees from whom you WITHHOLD your vote. Nominees receiving the most FOR votes will be elected. A properly executed proxy marked WITHHOLD with respect to the election of one or more nominees will not be voted with respect to the nominee or nominees indicated. Proxies may not be voted for more than three nominees.
With respect to Proposals 2 and 3, you may vote FOR, AGAINST or ABSTAIN. If you ABSTAIN from voting on Proposals 2 or 3, the abstention will have the same effect as an AGAINST vote.
Who will count the votes? Broadridge Financial Solutions, Inc. has been engaged as our independent agent to receive and tabulate shareholder votes. Broadridge will separately tabulate FOR, AGAINST and WITHHOLD votes, abstentions, and broker non-votes. The Inspectors of Election will certify the election results and perform any other acts required by Ohio Corporation Law.
What happens if the annual meeting is adjourned or postponed? Your proxy will still be effective and will be voted at the rescheduled Annual Meeting. You will still be able to change or revoke your proxy until it is voted.
Who is paying for the costs of this proxy solicitation? We will bear the expense of soliciting proxies. Proxies may also be solicited in person, by telephone or electronically by Nordson personnel who will not receive additional compensation for such solicitation. Copies of proxy materials and the Annual Report to Shareholders will be supplied to brokers and other nominees for the purpose of
6
soliciting proxies from beneficial owners, and we will reimburse such brokers or other nominees for their reasonable expenses.
How will I know the results of the Annual Meeting? The final voting results will be tallied by our Inspectors of Elections and published in a Current Report on Form 8-K that we expect to file within four business days of the Annual Meeting. If final voting results are not available to us in time to file a Form 8-K within four business days after the Annual Meeting, we intend to file a Form 8-K to disclose preliminary voting results and, within four business days after the final results are known, we will file an additional Form 8-K to disclose the final voting results.
Delivery of voting materials to shareholders sharing an address. To reduce the expense of delivering duplicate materials to shareholders sharing the same address, we have adopted a procedure approved by the Securities and Exchange Commission called “householding.” Under this procedure, certain shareholders of record who have the same address and last name will receive only one copy of the Annual Report to Shareholders and proxy materials until such time as one or more of these shareholders notifies us that they wish to receive individual copies. Shareholders of record in the same household continue to receive separate proxy cards.
We will mail materials that you request at no cost. You may contact us with your request by writing to or calling Corporate Communications, Nordson Corporation, 28601 Clemens Road, Westlake, Ohio, 44145 or 440-414-5606. You can also access the Proxy Statement and Annual Report online on our website at: www.nordson.com/investors.
How do I submit director nominations or shareholder proposals for the 2013 Annual Meeting?
Shareholder Proposals Submitted Under Rule 14a-8
Assuming that our 2013 Annual Meeting is held within thirty days of the anniversary of the 2012 Annual Meeting, any shareholder who wishes to submit a proposal for consideration at next year’s meeting and for inclusion in next year’s proxy statement under Rule 14a-8 of the Securities Exchange Act of 1934 should send the proposal c/o Secretary, Nordson Corporation, 28601 Clemens Road, Westlake, Ohio 44145 for receipt on or before September 25, 2012.
Proposals and Director Nominations Submitted Pursuant to our Regulations
Additionally, under our Regulations, a shareholder may submit a proposal for consideration at next year’s Annual Meeting of Shareholders, but not for inclusion in the Proxy Statement, if the shareholder provides written notice no earlier than 90 days and no later than 60 days prior to the 2013 Annual Meeting. Assuming that the 2013 Annual Meeting will be held on February 26, 2013, that means notice of such proposals must be received no earlier than November 28, 2012 and no later than December 28, 2012. The Company will publicly announce the date of the 2013 Annual Meeting in a timely manner. Our Regulations are available on our website at: www.nordson.com/governance.
A shareholder may nominate a candidate for election as a director at the 2013 Annual Meeting of the Shareholders provided the shareholder (i) is a shareholder of record at the time the shareholder gives notice of the nomination, (ii) is entitled to vote at the meeting in the election of directors, and (iii) has given timely written notice of the nomination to the Secretary. Similar to the timeliness requirements under our Regulations described above, the notice of the nomination must be received no earlier than 90 days and no later than 60 days prior to the meeting. Assuming the 2013 Annual Meeting is held on February 26, 2013, the deadlines would be no earlier than November 28, 2012 and no later than December 28, 2012. The Governance and Nominating Committee will assess the qualifications of the candidate according to criteria set out in Nordson Corporation’s Governance Guidelines, which are available on our website at: www.nordson.com/governance. For a candidate to be considered for election as a director or for business to be properly requested by a shareholder to be brought before an annual meeting of shareholders, the shareholder must comply with all of the requirements of our
7
Regulations, not just the timeliness requirements described above. All proposals for inclusion in the proxy materials, notices of proposals, suggestions for nominees for election to our Board should be sent to c/o Secretary, Nordson Corporation, 28601 Clemens Road, Westlake, Ohio 44145.
If the notices delivered pursuant to the Regulations are not timely received, then we will not be required to present such proposals or nominations, as applicable, at the 2013 Annual Meeting. If the Board chooses to present any information submitted after the deadlines set forth in the Regulations (other than pursuant to Rule 14a-8 of the Securities Exchange Act of 1934) at the 2013 Annual Meeting, then the persons named in proxies solicited by the Board for the 2013 Annual Meeting may exercise discretionary voting power with respect to such information.
YOUR VOTE IS VERY IMPORTANT, SO PLEASE VOTE.
Promptly return your proxy card or vote via telephone or the Internet,
which will help to reduce the cost of this solicitation.
This Proxy Statement and the enclosed proxy card are being mailed to shareholders of record on or about January 23, 2012. Nordson’s executive offices are located at 28601 Clemens Road, Westlake, Ohio 44145, telephone number (440) 892-1580.
PROPOSAL 1: ELECTION OF DIRECTORS WHOSE TERMS EXPIRE IN 2015
Our Regulations require us to have at least nine directors with not less than three directors in each of three classes. Each of the directors serves for a term of three years and until a qualified successor is elected. The Board currently has nine directors.
The Governance and Nominating Committee is responsible for identifying and evaluating nominees for director and for recommending to the Board a slate of nominees for election at the Annual Meeting of Shareholders. The Governance and Nominating Committee has recommended to the Board, and the Board has approved, the persons named as nominees for terms expiring in 2015 and, unless otherwise marked, a proxy will be voted for such nominees. Mr. Merriman currently serves as a director, last elected by the shareholders at the 2009 Annual Meeting. All nominees have agreed to stand for election to a three-year term.
It is intended that proxies that are submitted but do not withhold the authority to vote for any or all of the nominees will be voted for the election as directors of all of the persons named below. At this time, the Board knows of no reason why any nominee might not be a candidate at the 2012 Annual Meeting.
The name and age of each of the three nominees for election as directors for terms expiring in 2015, as well as present directors whose terms will continue after the meeting, appear below together with his or her principal occupation for at least the past five years, the year each became a director of the Company and certain other information.
8
Nominees For Terms Expiring in 2015
Name | Age | Business Experience and Directorships for Previous Five Years and Qualifications to Serve | Director Since | |||||
Arthur L. George, Jr. | 50 | Business Experience. Mr. George has served as Senior Vice President and Manager, Analog Engineering Operations of Texas Instruments Incorporated (NASDAQ GS: TXN) since 2011. Texas Instruments is one of the world’s largest semiconductor companies and a highly innovative, high performing global leader in analog, embedded processing and wireless technologies.Mr. George was Senior Vice President and Worldwide General Manager, High Performance Analog of Texas Instruments from 2006 to 2011. | — | |||||
| Key Attributes, Experiences and Skills. Mr. George brings to the Board significant executive general management experience as well as extensive operational and new product development experiences in high technology markets. Mr. George’s experience with High Performance Analog products used in a wide range of industrial products gives him insight to a diverse set of industries and affords the Board a unique perspective in identifying strategic and tactical risks attendant to the semiconductor electronics market. | ||||||||
Frank M. Jaehnert | 54 | Business Experience. Mr. Jaehnert has been Chief Executive Officer and President of Brady Corporation (NYSE: BRC) since April 1, 2003. Brady Corporation is an international manufacturer and marketer of complete solutions that identify and protect premises, products and people. Brady’s core capabilities in manufacturing, channel management, printing systems, precision engineering and materials expertise make it a leading supplier to customers in general manufacturing, maintenance and safety, process industries, construction, electrical, telecommunications, electronics, laboratory/healthcare, airline/transportation, brand protection, education, governmental, public utility, and a variety of other industries. | — | |||||
| Key Attributes, Experiences and Skills. Mr. Jaehnert brings extensive, broad-based international business and executive management and leadership experience to our Board, and, coupled with a demonstrated execution of strategic vision and a well-developed understanding of financial accounting and financial matters, compliments strongly the skill sets of our present directors. | ||||||||
Michael J. Merriman, Jr. | 55 | Business Experience. Mr. Merriman has been an Operating Advisor of Resilience Capital Partners LLC since June 2008. Resilience is a private equity firm focused on principal investing in lower middle market underperforming and turnaround situations. Mr. Merriman is a business consultant for Product Launch Ventures, LLC, a company that he founded in 2004 to pursue consumer product opportunities and provide business advisory services. Mr. Merriman served as President and Chief Executive Officer of The Lamson & Sessions Co., a manufacturer of thermoplastic conduit, fittings and electrical switch and outlet boxes from November 2006 to November 2007. Mr. Merriman served as Senior Vice President and Chief Financial Officer of American Greetings Corporation (NYSE: AM), a designer, manufacturer and seller of greeting cards and other social expression products from September 2005 until November 2006. | 2008 | |||||
9
|
| |||||
Present Directors Whose Terms Expire in 2013
Name | Age | Business Experience and Directorships for Previous Five Years and Qualifications to Serve | Director Since | |||||
Lee C. Banks | 48 | Business Experience. Mr. Banks has served as Executive Vice President and Operating Officer of Parker Hannifin Corporation since 2008. Parker Hannifin Corporation (NYSE: PH) is the world’s leading diversified manufacturer of motion and control technologies and systems, providing precision-engineered solutions for a wide variety of mobile, industrial and aerospace markets. Mr. Banks was Senior Vice President and Operating Officer of Parker Hannifin from 2006 to 2008 and served as its Worldwide President, Hydraulics Group from 2003 to 2006. | 2010 | |||||
| Key Attributes, Experiences and Skills. As a senior executive with a multinational corporation, Mr. Banks provides the Board with significant executive general management and operational experiences and a unique perspective in identifying strategic and tactical risks attendant to a multinational sales, distribution, manufacturing and operational footprint. | ||||||||
Randolph W. Carson | 60 | Business Experience. From 2000 to February 2009, Mr. Carson served as Chief Executive Officer of the Electrical Group of Eaton Corporation (NYSE: ETN), a global diversified industrial manufacturer and technology leader in electrical components and systems for power quality, distribution and control. Mr. Carson retired from Eaton in May 2009 following 10 years with the company. Prior to Eaton Corporation, Mr. Carson held several executive positions with Rockwell International. | 2009 | |||||
| Other Directorships in Previous 5 Years. Mr. Carson is presently a director of Fairchild Semiconductor Inc. (NYSE: FSC), a leading global manufacturer of semiconductor devices; Graftech International Inc. (NYSE: GTI), a global manufacturer of carbon and graphite products; and the Southwire Company, the leading North American supplier of wire and cable products. | ||||||||
10
Name | Age | Business Experience and Directorships for Previous Five Years and Qualifications to Serve | Director Since | |||||
| Key Attributes, Experiences and Skills. Our Board believes that Mr. Carson’s deep operational experience in global industrial businesses enables him to provide unique insight to our Board with respect to meeting marketplace challenges, implementing LEAN and other productivity initiatives, integrating business units and anticipating and planning for commercial risk and uncertainties. Together with his experience, strategic vision and understanding of financial accounting and financial matters, our Board believes Mr. Carson is well qualified to serve as a member of our Board. Mr. Carson’s public company board experience contributes to his familiarity with current issues that assists in identifying and addressing matters that come before the Governance & Nominating and Audit Committees on which he serves. | ||||||||
Michael F. Hilton | 57 | Business Experience. Mr. Hilton became Nordson’s President and Chief Executive Officer effective January 16, 2010. Prior to his joining Nordson, Mr. Hilton was Senior Vice President and General Manager for Air Products and Chemicals Inc. (NYSE: ADP) with specific responsibility for leading the company’s $2 billion global Electronics and Performance Materials segment. From October 2006 through September 2007, Mr. Hilton was Vice President and General Manager of Air Products and Chemicals’ Electronics and Performance Materials segment. Mr. Hilton served as Air Products and Chemicals’ Vice President, Electronics Business from 2003 to 2006. Air Products and Chemicals Inc. serves customers in industrial, energy, technology and healthcare markets worldwide with a unique portfolio of atmospheric gases, process and specialty gases, performance materials, and equipment and services. | 2010 | |||||
| Key Attributes, Experiences and Skills. Mr. Hilton is the only member of Nordson’s management serving on the Board. Mr. Hilton has over 30 years of global manufacturing industry experience. Mr. Hilton brings to the Board an intimate understanding of management leadership, strategy development and day-to-day operations of a multinational company, including product line management, new product, technology and talent development, manufacturing, distribution and other sales channels, business processes, international operations and global markets. | ||||||||
Victor L. Richey, Jr. | 54 | Business Experience. Mr. Richey has served as Chairman of the Board, President and Chief Executive Officer of ESCO Technologies Inc. (NYSE: ESE) since 2003. ESCO Technologies is a diversified manufacturer of special purpose utility solutions for electric, gas and water utilities, including hardware and software to support advanced metering applications and fully automated intelligent instrumentation; engineered filtration products to the aviation, space and process markets worldwide; and is the industry leader in RF shielding and EMC test products. | 2010 | |||||
| Other Directorships in Previous 5 Years. Mr. Richey is presently Chairman of the Board of ESCO Technologies Inc. | ||||||||
| Key Attributes, Experiences and Skills. The Board believes Mr. Richey’s extensive experience as Chairman and Chief Executive Officer of a diversified global producer and marketer of technology, and his significant executive management and board experience at public and private companies within some of our end markets, including the semiconductor industry provides a breadth of skills critical to the Board’s ability to discharge its oversight responsibility. | ||||||||
11
Present Directors Whose Terms Expire in 2014
Name | Age | Business Experience and Directorships for Previous Five Years and Qualifications to Serve | Director Since | |||||||
Joseph P. Keithley | 63 | Business Experience. Mr. Keithley has served as Chairman of the Board of Nordson Corporation since February 2010. He served as Chairman of the Board of Keithley Instruments, Inc., a provider of measurement solutions to the semiconductor, fiber optics, telecommunications and electronics industries from 1991 and a member of its Board of Directors from 1986 until December 2010 when Keithley Instruments was purchased by Danaher Corporation. He also served as Keithley Instruments, Inc.’s Chief Executive Officer from November 1993 to December 2010 and as President from May 1994 to December 2010. | 2001 | |||||||
| Other Directorships in Previous 5 Years. Mr. Keithley previously served as Chairman of the Board of Keithley Instruments and currently serves as a director of Materion Corporation (NYSE: MTRN), an integrated producer of high performance engineered materials used in a variety of electrical, electronic, thermal and structural applications and Axcelis Technologies, Inc. (NASDAQ GS: ACLS), a provider of equipment and service solutions for the semiconductor manufacturing industry. | ||||||||||
| Key Attributes, Experiences and Skills. Mr. Keithley brings an extensive, broad-based international business and executive management and leadership experience from his leadership roles at Keithley Instruments, Inc. to his role as Chairman of our Board of Directors. Among other things, Mr. Keithley draws upon his extensive knowledge in the global semiconductor and electronics industries garnered while leading Keithley Instruments, Inc. Mr. Keithley also has extensive public company board and governance experience. | ||||||||||
Mary G. Puma | 53 | Business Experience. Ms. Puma is presently Chairman of the Board and Chief Executive Officer of Axcelis Technologies, Inc. (NASDAQ GS: ACLS), a provider of equipment and service solutions for the semiconductor manufacturing industry. Previous to her election as President and Chief Executive Officer of Axcelis in January 2002, Ms. Puma served as Axcelis’ President and Chief Operating Officer from May 2000 to January 2002. | 2001 | |||||||
| Other Directorships in Previous 5 Years. Ms. Puma is presently Chairman of the Board of Axcelis Technologies, Inc. | ||||||||||
| Key Attributes, Experiences and Skills. Ms. Puma contributes extensive general management experience in an international, technology-driven business and a thorough knowledge of corporate governance and strategy development. Ms. Puma brings valuable experience with compensation and succession planning issues to our Compensation and Governance & Nominating Committees, respectively. | ||||||||||
William L. Robinson | 70 | Business Experience. For the last twelve years, Mr. Robinson has been a professor of law at the University of the District of Columbia’s David A. Clarke School of Law, currently in the capacity of Distinguished Professor of Law. | 1995 | |||||||
12
|
| |||||
Former directors Benedict Rosen and William Madar retired from our Board in 2011. As previously disclosed, Dr. Ignat will retire effective with the expiration of his, term on February 28, 2012.
No shareholderher or group that beneficially owns 1% or more of our outstanding common shares has recommended a candidate for election as a director at the 2012 Annual Meeting of Shareholders.its intention to request cumulative voting.
Required Vote
The election of directors requires the affirmative vote of the holders of a plurality of the shares of common stock voting at the meeting. Under the plurality voting standard, the nominees receiving the most “for” votes will be elected, regardless of whether any nominee received a majority of the votes. Only shares that are voted in favor of a particular nominee will be counted toward such nominee’s achieving a plurality. Shares present at the meeting that are not voted for a particular nominee or shares present by proxy where the shareholder properly withheld authority to vote for such nominee (including broker non-votes) will not be counted toward such nominee’s achieving a plurality, but will be counted for quorum purposes.
RECOMMENDATION REGARDING PROPOSAL 1:
THE BOARD OF DIRECTORS RECOMMENDS THAT YOU VOTE “FOR”
THE ELECTION OF ALL NOMINEES AS DIRECTORS.
PROXIES RECEIVED BY THE BOARD WILL BE VOTED FOR ALL NOMINEES UNLESS
SHAREHOLDERS SPECIFY A CONTRARY VOTE.
1316
Corporate Governance Documents
The following corporate governance documents are available on our website at: www.nordson.com/governance.governance.
• Governance Guidelines | • Related Persons Transaction Policy | |
• Committee Charters | • Share Ownership Guidelines | |
• Director Recruitment and Performance Guidelines | • Code of Ethics and Business Conduct |
The Governance Guidelines contain general principles regarding the functions of Nordson’s Board of Directors (the “Board”) and Board Committees.committees. The 20112013 Annual Report to Shareholders which includes our Annual Report on Form 10-K and this Proxy Statement are available on our website at:www.nordson.com/investors. Upon request, copies of the Annual Report to Shareholders will be mailed to you (at no charge) by contacting Attn: Corporate Communications, Nordson Corporation, 28601 Clemens Road, Westlake, Ohio 44145.
Director Independence
In accordance with the listing standards of The NASDAQ Stock Market LLC (NASDAQ)(“NASDAQ”), and our Corporate Governance Guidelines, the Board must consist of a majority of independent directors. The Board has determined that Messrs. Banks, Carson, George, Jaehnert, Keithley, Merriman, Richey, Robinson, and Ms. Puma each satisfy the definition of “independent director” under these listing standards. William L. Robinson, who retired from our Board on May 10, 2013, also satisfied such definition of “independent director” during his service as a director. Mr. Hilton is not an independent director as he serves as the company’sCompany’s President and Chief Executive Officer. In making this determination, the Board reviewed the information provided by the directors and Nordson with regard to each director’s business and personal activities as they may relate to Nordson and its management.
For a director to be considered independent under the NASDAQ listing standards, the Board must affirmatively determine that a director has no direct or indirect material relationship with Nordson. A director is independent if he/she has no material relationship with us or our affiliates either directly or indirectly as a partner, shareholder or officer of an organization that has a relationship with our Company and meets the standards for independence as defined by the rules of NASDAQ. Such relationships can include commercial, industrial, banking, consulting, legal, accounting, charitable and familial relationships, among others.
More specifically, a director is not considered independent if:
he/shethe director is currently employed, or has been employed within the past three years, by us or any of our affiliates;
the director (or his/her immediate family member as defined by NASDAQ) accepted compensation from us or any of our affiliates in excess of $120,000 during any twelve month period within the past three fiscal years (other than compensation for board service, retirement plan benefits, or non-discretionary compensation, or compensation paid to a family member who is an employee (other than an executive officer));
the director has an immediate family member who is, or has been in the past three fiscal years, employed by us or any of our affiliates as an executive officer;
the director (or any immediate family member) is or has been a partner, controlling stockholdershareholder or an executive officer of any business to which we made, or from which we received, payments (other than those which arise solely from investments in our securities) that exceed five percent of such entity’s consolidated gross revenues for that year, or $200,000, whichever is more, in any of the past three fiscal years;
1417
the director (or his/her immediate family member) is or has been employed as an executive officer of another entity where any of our executive officers serve on that entity’s compensation committee;
he/shethe director (or any immediate family member) is a current partner of our independent registered public accounting firm, Ernst & Young LLP, or either the director (or an immediate family member) has been a partner or employee of Ernst & Young LLP in the past three fiscal years and worked on our audit during that time; or
the director participated in the preparation of our (or any of our current subsidiaries’) financial statements at any time during the past three fiscal years.
In addition, on anAs part of our commitment to ensuring director independence, we have a monitoring and reporting program with respect to purchases of products supplied by a company which may employ a director to ensure the avoidance of any conflicts of interest resulting from our relationship. Mr. Banks, a director, serves as Executive Vice President and Operating Officer of Parker Hannifin Corporation. Mr. George, a director, serves as Senior Vice President and Manager, Analog Engineering Operations of Texas Instruments Incorporated. Mr. Jaehnert, a director, served as President and Chief Executive Officer of Brady Corporation until October 7, 2013. These three companies purchase components manufactured by a number of our business units in volumes that are insignificant when compared to the respective companies’ and Nordson’s annual basis, each memberrevenue for fiscal year 2013. The Board does not believe that these relationships impair the independence of Messrs. Banks, George or Jaehnert or that they have any material interest in any transaction between the Board is required to complete a questionnaire designed in part to provide information to assist the Board in determining whether the director is independent.Company and Parker Hannifin, Texas Instruments, and Brady Corporation, respectively.
Director Qualifications
Our directors play a critical role in guiding Nordson’s strategic direction and overseeing the management of the Company. The Board believes that diversity along multiple dimensions, including opinions, skills, perspectives, personal and professional experiences and other differentiating characteristics, is an important element of its director nomination recommendations.recommendations as variety of points of view contribute to a more effective decision-making process. To that end, the Board has adopted Director Recruitment and Performance Guidelines (the “Recruitment Guidelines”) to assist the Board and the Governance and Nominating Committee in identifying and recruiting directors to serve on the Board. The Board considers each nominee in the context of the Board as a whole, with the objective of assembling a Board that can best maintain the success of our business. The Board seeks to include an array of skills and experience in its overall composition rather than requiring every director to possess the same skills, perspective, and interests. The Recruitment Guidelines are implemented
Consideration of Director Candidates Recommended by seeking to identify candidates that bring diverse skill sets, backgrounds, and experiences, including ethnic and gender diversity, toShareholders
Under its charter, the Board when director candidates are needed.
An example of the process engaged in by the Board to identify qualified candidates for director was the search that culminated in the election of the most recently added directors — Messrs. Banks and Richey. The Board of Directors retained a search firm to assist the Board in identifying candidates that not only met the Recruitment Guidelines but also a set of specific criteria deemed appropriate given the skills and experiences of the directors that had recently retired or were about to retire from the Board. Included in the search criteria were skills and experiences such as leading a company or division of a sophisticated, business-to-business industrial enterprise similar in size to Nordson that has a material percentage of sales (at least 25 percent-plus) derived from non-US customers; having substantive global experience with a company composed of multiple business units in an innovative and research and product development-based environment; and prior exposure to corporate governance as the result of public company board service or the experience of working with the board of directors and governance process. The effectiveness of the process is evident by the contributions made to the Board by Messrs. Banks and Richey since their election in 2010. Also, it was through this same rigorous process that Messrs. George and Jaenhert, nominees for election during the 2012 Annual Meeting, were identified as candidates qualified to serve as members of our Board.
The Governance and Nominating Committee periodically reviewsis responsible for reviewing shareholder nominations for directors. The Committee does not have a formal policy with respect to the Board’s membershipconsideration of director candidates recommended by shareholders. However, its practice is to consider those candidates on the same basis and in light of our business model and strategic objectives,the same manner as it considers whether the directors possess the requisite skills, experience and perspectives to oversee the Company in achieving these objectives, and may seek additional directorsrecommendations from time to time as a result of its consideration. Qualified candidates are evaluated without regard to race, color, religion, sex, ancestry, national origin or disability.other sources.
15
Code of Ethics and Business Conduct
We have a Code of Ethics and Business Conduct (the “Code”) that addresses our commitmentapplies to honesty and integrity and the ethical behavior of ourall directors, officers and employees of Nordson Corporation and its subsidiaries wherever located. Our Code contains the general guidelines and principles for conducting Nordson’s business consistent with current and potential customers, fellow employees, competitors, government and self-regulatory agencies, investors, the public, the media and anyone else with whom we have or may have contact. Violations of any of thehighest standards of business ethics. Our Code embodies our five guiding values, which form the foundation of our Company: Integrity, Excellence, Passion for Our Customers, Energy, and Respect for People. We encourage our employees to report all suspected violations of Company policies and the law, including incidents of harassment or discrimination. We will take appropriate steps to investigate all such reports and will take appropriate action. Under no circumstances will employees be subject to any disciplinary
18
or retaliatory action for reporting, in good faith, a possible violation of our Code will be met with appropriate disciplinary action, up to and including terminationor applicable law or for cooperating in any investigation of employment. Retaliation against any director, officer or employee who files a report concerning what he or she reasonably believes to be conduct that violates the Code is strictly prohibited.possible violation.
Communications with the Board of Directors
Shareholders may communicate with the Board, the Chairman of the Board, a Board committee, the non-employee directors as a group, or individual directors by sending written communications addressed to the Board of Directors, a Board committee or such individual director or directors, c/o Secretary, Nordson Corporation, 28601 Clemens Road, Westlake, Ohio 44145.
Each communication should specify the applicable addressee or addressees to be contacted as well as the general topic of the communication. Our Secretary will initially receive and processreview communications before forwarding them to members of the Board to whom the communication is directed, or if the communication is not directed to any specific member(s) of the Board, to the Chairperson of the Governance and Nominating Committee. We generally will not forward a shareholder communication that is primarily commercial in nature, relates to an improper or irrelevant topic, or requests general information about us. Concerns about accounting or auditing matters or possible violations of our Code of Ethics and Business Conduct should be reported pursuant to the procedures outlined in the Code.
Board Leadership Structure
Our Governance Guidelines require us to have either an independent Chairman of the Board or a presiding independent director if the positions of Chairman and Chief Executive Officer are held by the same person.is not an independent director. The Guidelines set forth the responsibilities of the Chairman of the Board and the Presiding Director when the Chairman of the Board and Chief Executive Officer positions are combined.is not an independent director. At present, the Chairman of the Board of Directors position is separate from the Chief Executive Officer position.
This structure provides independent oversight of management while permitting our Chief Executive Officer, Michael Hilton, to focus his time and energy on setting the strategic direction for the Company, overseeing daily operations, engaging with external constituents, developing and mentoring our future leaders, and promoting employee engagement at all levels of the organization. Meanwhile, ourOur independent Chairman, Joseph Keithley, leads the Board in the performance of its duties by establishing agendas and ensuring appropriate meeting content (in collaboration with Mr. Hilton), presiding during regularly held executive sessions with our independent directors, actively engaging with all independent directors and Mr. Hilton between Board meetings and providing overall guidance to Mr. Hilton as to the Board’s views and perspectives, particularly on the strategic direction of the Company.
Executive Sessions
Pursuant to our Governance Guidelines, non-managementindependent directors meet in regularly scheduled executive sessions without management. The Chairman (or, when our Chairman is not an executive officer,independent director, the Lead IndependentPresiding Director) chairs all regularly scheduled executive sessions of the Board, and also has authority to convene meetings of the non-managementindependent directors at any time with appropriate notice. Chairman Keithley presided at executive sessions of our independent directors at every regularly scheduled Board meeting in 2011.2013.
16
Oversight of Risk Management
The Board as a whole exercises its oversight responsibilities with respect to material risks we face in a global market, including operational, financial, strategic, competitive, reputational, legal and regulatory risks. The Board has delegated responsibility for the oversight of specific risks to Board committees. With the oversight of our Board, our officers are responsible for the day-to-day management of the material risks we face. In its oversight role, our Board has the responsibility to satisfy itself that the risk management processes designed and implemented by management are adequate and functioning as designed. The involvement of the Board in setting our business strategy at least annually is a key part
19
of its oversight of risk management, its assessment of management’s appetite for risk and its determination of what constitutes an appropriate level of risk for Nordson Corporation. The Board regularly receives updates from management and outside advisors regarding this oversight responsibility.
In addition, our Board committees each oversee certain aspects of risk management. For example, our Audit Committee is responsible for overseeing risk management of financial matters, financial reporting, the adequacy of our risk-related internal controls, and internal investigations. Our Compensation Committee oversees risks related to the executive officer compensation program such as that attendant to incentive-driven compensation plans. Our Governance and Nominating Committee oversees governance related risks, such as Board independence and director succession planning.
Senior management attends Board and Board committee meetings at the invitation of the Board or its committees and is available to address any questions or concerns raised by the Board on risk management and any other matters. Annually, the Board holds strategic planning sessions with senior management to discuss strategies, key challenges, and risks and opportunities for the Company.
Both the Audit Committee and the Compensation Committee of the Board also rely on the advice and counsel of our independent auditors and compensation consultant, respectively, to raise awareness of any risk issues that may arise during their regular reviews of our financial statements, audit work and executive compensation policies and practices, as applicable. The Board is kept abreast of its Committees’ risk oversight and other activities via reports of the Committee Chairpersons to the full Board.
Attendance at the Annual Meeting of Shareholders
Directors are expected to attend the Annual Meeting of Shareholders and all Board meetings and meetings of committees on which a director serves. During the last fiscal year, each incumbent director attended at least seventy-five percent of the meetings of the Board and of the committees on which he or she served. All incumbent directors attended the 20112013 Annual Meeting of Shareholders.Meeting.
Review of Transactions with Related Persons
The Board has adopted a written policy regarding the review and approval of transactions, involving certain persons that are required to be disclosed in proxy statements, which are commonly referred to as “related person transactions.” Related partiespersons include our directors, nominees for election as a director, persons controlling over 5% of our common shares, executive officers, and the immediate family members of each of these individuals. Under the written policy, Nordson’s Audit Committee is responsible for reviewing and approving any related person transactions and will consider factors it deems appropriate, including:
appropriate. To the approximate dollar amountextent any member of the Audit Committee is involved in theany transaction including the amount payable to the related person;
the nature of the interest of the related person in the transaction;
whether the transaction may involve a conflict of interest;
17
whether the transaction involves the provision of goods or services to Nordson that are available from unaffiliated third parties and, if so, whether the related person transaction is on terms no less favorable than terms generally available to an unaffiliated third party under the same or similar circumstances; and
the purpose of the transaction and any potential benefits to Nordson.
There are no related person transactions to report in this Proxy Statement. Mr. Banks, a director, serves as Executive Vice President and Operating Officer of Parker Hannifin Corporation. Parker Hannifin Corporation is a supplier of components to a number of our business units in volumes that are insignificant when compared to the Parker Hannifin Corporation’s and Nordson’s annual revenue for 2011. All purchases were conducted at arms-length. We have a monitoring and reporting program with respect to purchases oftransactions with products supplied by a company which may employ a director to ensure the avoidance of any conflicts of interest resulting from our relationship. This program includes all such transactions collectively over $120,000 in one annual period. Under the program we reviewed transactions with three companies that employ three of our directors. The review determined that the related persons transactions were neither material nor significant to either Nordson or the respective director’s company. All such transactions were conducted at arms-length. Information on the related persons transaction review is set forth under the caption “Director Independence” above.
Self-Assessments
On a regular basis, the Board conducts a self-assessment to determine, among other matters, whether the Board and the Committeescommittees are functioning effectively. The independent directors also undertake a peer assessment of other independent directors as part of this self-assessment process. The Audit,
20
Compensation, and Governance and Nominating Committees are also required to each conduct a self-assessment. The Governance and Nominating Committee is responsible for overseeing this self-assessment process.
MEETINGS AND COMMITTEES OF THE BOARD OF DIRECTORS
Board of Directors. Our Board of Directors has five regularly scheduled meetings each year. Special meetings are held as necessary. In addition, management and the directors communicate informally on a variety of topics, including suggestions for Board or committee agenda items, recent developments and other matters of interest to the directors. In Fiscal Year 2011,fiscal year 2013, our Board of Directors met fivefour times in regular session and held onetwo special meeting.meetings. An executive session of independent directors occurred at each regular meeting.
The Board has three committees which meet on a regular basis: an Audit Committee, a Compensation Committee, and a Governance and Nominating Committee. The table below provides current committee membershipmemberships and Fiscal Year 2011fiscal year 2013 committee meeting information:
Director | Audit | Compensation | Governance & Nominating | Audit | Compensation | Governance & Nominating | ||||||||
Lee C. Banks | X | Ö | ||||||||||||
Randolph W. Carson | X | X | Ö | Ö | ||||||||||
David W. Ignat (1) | X | X | ||||||||||||
Arthur L. George, Jr. | Ö | |||||||||||||
Frank M. Jaehnert | F | Ö | ||||||||||||
Joseph P. Keithley | X | X | Ö | Ö | ||||||||||
Michael J. Merriman, Jr. (2) | X* | |||||||||||||
Michael J. Merriman, Jr. | F | Chairperson | ||||||||||||
Mary G. Puma | X * | X | Chairperson | Ö | ||||||||||
Victor L. Richey, Jr. | X | Ö | Chairperson | |||||||||||
William L. Robinson (3) | X | X * | ||||||||||||
Total meetings in Fiscal Year 2011 | 9 | 6 | 4 | |||||||||||
Total meetings in fiscal year 2013 | 9 | 5 | 3 | |||||||||||
Audit Committee. The Audit Committee conducted nine meetings in Fiscal Year 2011.fiscal year 2013. All members of the Audit Committee meet the NASDAQ independence standards and the Securities and Exchange
18
Commission’sSEC’s heightened audit committee independence standards. The Board has designated Mr.Messrs. Jaehnert and Merriman as “audit committee financial expert”experts” pursuant to the Securities and Exchange Commission’sSEC’s final rules implementing Section 407 of the Sarbanes-Oxley Act. Shareholders should understand that the designation of each of Messrs. Jaehnert and Merriman as an “audit committee financial expert” is an SEC disclosure requirement and that it does not impose upon them any duties, obligations or liabilities that are greater than those imposed on them as members of the Audit Committee and the Board in the absence of such designation. The Audit Committee is responsible for:
reviewing the proposed audit programs (including both independent and internal audits) for each fiscal year, the results of these audits, and the adequacy of our systems of internal accounting control;
appointing, compensating and overseeing the independent auditors for each fiscal year;
approving all permissible audit and non-audit services to be performed by the independent auditors;
establishing procedures for the receipt, retention, and treatment of complaints received by us regarding accounting, internal accounting controls, or auditing matters;
approving all related-persons transactions; and
overseeing the adequacy of financial statements pertaining to our benefit plans, including reserves, statement of funding obligations and underlying economic assumptions.
A more detailed discussion of the purposes, duties, and responsibilities of the Audit Committee is found in the Committee’s charter which is available on our website at:www.nordson.com/governance. The Committee has discussed with the independent auditors the auditors’Ernst & Young its independence from management and the Company, and considered theincluding compatibility of non-audit services with the auditors’ independence. The Audit Committee Report to the Board is at Appendix A of this Proxy Statement.
21
Compensation Committee. The Compensation Committee is currently comprised of four non-employee directors, each of whom the Board has determined to be “independent” as defined by the NASDAQ listing standards applicable to compensation committee members. The Compensation Committee met sixfive times in Fiscal Year 2011.fiscal year 2013. The Compensation Committee is responsible for (i) setting and approving compensation for our executive officers andofficers; (ii) for administering the incentive and equity participation plans under which we pay variable compensation to our executive officers.officers; and (iii) providing oversight to executive talent and management succession planning, other than chief executive officer succession which is a responsibility of the entire Board. A more detailed discussion of the purposes, duties, and responsibilities of the Committee is found in the Committee’s charter which is available on our website at:www.nordson.com/governance. All members of the Compensation Committee meet the NASDAQ independence standards.
The Compensation Committee takes significant steps to ensure that we maintain strong links between executive compensation and performance.performance of our business. Examples of these steps are:
holding executive sessions (without management present) at every regularly scheduled Committee meeting;
engaging an outsideindependent compensation consultant to advise on executive compensation issues, including peer benchmarking data;
realigningaligning compensation structures based on examination of peer group compensation structures and levels and peer group financial performance; and
strengthening the link between executive officer annual paycompensation and shareholder value by basing incentive/variable pay on the achievement of financial measures and additional business and personal objectives and modifying the mix of compensation elements to increase the allocation of compensation linked to corporate performance.
Each fiscal year the Committee:
sets base salary;
sets measures for the annual cash incentive plan and long-term incentive planplans; and certifies
verifies performance against those measures prior to any incentive plan payouts; andpayouts.
19
sets performance measures and levels for the prospective fiscal year annual cash incentive plan and the prospective long-term incentive plan three-year performance period.
A discussion of the role of executive management in setting compensation may be found in Part II of the Compensation Discussion and Analysis section of this Proxy Statement under the caption “Role of the Executive Compensation Consultant and Executive Management.”
The Committee also has the authority to engage outside executive compensation consultants, to determine the independence of the consultant and scope of the consultant’s services, and to terminate the consultant’s engagement. The compensation consultant reports directly to the Chairperson of the Committee and provides the Committee with information and analysis related to executive compensation. A discussion of the engagement of Mercer as our independent compensation consultant for Fiscal Year 2011fiscal year 2013 is found in Part II of the Compensation Discussion & Analysis under the caption, “Role of the Executive Compensation Consultant and Executive Management.”
Governance and Nominating Committee. The Governance and Nominating Committee met fourthree times during Fiscal Year 2011.fiscal year 2013. All members of the Governance and Nominating Committee meet the NASDAQ independence standards. The purposes of the Governance and Nominating Committee are to:
assist the Board by identifying individuals qualified to become Board members,serve as directors, and to recommend to the Board the director nominees for each annual meeting of shareholders;
review and recommend to the Board qualifications for committee membership and committee structure and operations;
recommend to the Board directors to serve on each committee and a chairperson for such committee;
develop and recommend to the Board a set of corporate governance policies and procedures; and
leaddevelop, administer and oversee the self-assessment process for the Board inand its annual review of the Board’s performance.Committees.
22
The Governance and Nominating Committee assesses the qualifications of the candidates nominated to be a director according to criteria set out in Nordson Corporation’s Governance Guidelines. A more detailed discussion of the purposes, duties, and responsibilities of the Committee is found in the Committee’s charter which is available at:www.nordson.com/governance.
For information on the process for shareholders to nominate a director candidate to the Committee, see “Questions and Answers About the Annual Meeting and these Proxy Materials: How do I submit director nominations or shareholder proposals for the 2015 Annual Meeting – Proposals and Director Nominations Submitted Pursuant to our Regulations.”
Executive Committee. The Executive Committee exercises the authority of the Board on such matters as are delegated to it by the Board from time to time and exercises the powers of the Board between meetings of the Board. The Executive Committee meets on a periodic basis, as needed, and met two times in Fiscal Year 2011.fiscal year 2013.
Director Compensation
We structure director compensation to attract and retain qualified non-employee directors and to further align the interests of our directors with the interests of our long-term shareholders by linking a substantial portion of their compensation to the performance of our common shares. Following is a description of our compensation program for non-employee directors for Fiscal Year 2011.fiscal year 2013. Directors who are also our employees do not receive compensation for their services as directors.
Determining Director Compensation. The Governance and Nominating Committee reviews, with the assistance of the Compensation Committee’s executive compensation consultant, the compensation of our directors and makes recommendations to the Board regarding these matters. The Committee typically conducts its review and makes its recommendations in September of each year prior to the commencement of athe upcoming fiscal year.
20
In benchmarking director pay, the Company useswe use the same compensation peer group that is used to benchmark compensation for the Company’sour named executive officers as described in the Compensation Discussion and Analysis section of this Proxy Statement.
The components and respective amounts of director compensation for Fiscal Year 2011fiscal year 2013 were:
Type | Annual Amount ($) | |||
• Annual Cash Retainer (all directors) | 60,000 | |||
• Chairman’s Cash Retainer | 50,000 | |||
• Committee Chair Cash Retainer: | ||||
¡ Audit Committee Chair | 10,000 | |||
¡ Compensation Committee Chair | 7,500 | |||
¡ Governance & Nominating Committee Chair | 5,000 | |||
• Equity Grant (Restricted Shares) | 80,000 | (1) | ||
Type | Annual Amount ($) | |
• Annual Cash Retainer | 60,000 | |
• Chairman of the Board’s Cash Retainer | 50,000 | |
• Committee Chair Cash Retainer: | ||
¡ Audit Committee Chair | 12,000 | |
¡ Compensation Committee Chair | 10,000 | |
¡ Governance & Nominating Committee Chair | 5,000 | |
• Equity Grant (Restricted Shares) | 110,000(1) |
| (1) |
Cash Retainers. The cash retainers are paid in equal quarterly installments. For directors who retire or who are elected by the Board or shareholders during the fiscal year, the annual retainer is prorated based on the number of months served in the fiscal year prior to the date of retirement for retiring directors and number of months remaining in the fiscal year for directors elected after the commencement of a fiscal year.
Effective at the beginning of Fiscal Year 2011, the Chairman of the Board’s retainer increased from $25,000 to $50,000 and the Compensation Committee chairperson’s retainer increased from $5,000 to $7,500.
Restricted ShareEquity Grant. Restricted shares are granted early in the fiscal year to present directors or at the timebeginning of a director is elected to the Board. The grants carry a two-year restriction on transfer.fiscal year. If a director retires from the Board prior to the one year anniversary of the grant, shares are forfeited on a pro-rata basis, based on the number of months served prior to retirement. If a director is elected by the Board or shareholders after the commencement of a fiscal year, the restricted share grant is prorated based on the number of months remaining in the fiscal year. The grant vests in one year but carries a two-year restriction on transfer.
23
Deferred Compensation Program. Under the Directors Deferred Compensation Plan,directors deferred compensation plan, non-employee directors may elect to defer all or a portion of their annual cash retainer and restricted share grant into a non-qualified, unfunded deferred compensation program.account in the form of deferred cash or share equivalent units. Amounts deferred under the Directors Deferred Compensation Plan(i) as cash will earn a return equivalent to the return on an investment in (i) an interest-bearing account, earning interest based on the 10-year Treasury bill constant maturity rate, or (ii) aas share equivalent account, earningunits will earn a return based on our common share price and accruing dividend equivalents. AnyWe do not pay above market or preferential interest rates under this deferred compensation plan.
Directors may also elect to defer the receipt of restricted shares prior to the grant date. If receipt is deferred, directors will receive restricted share grant that a non-employee director electsunits in lieu of restricted shares. The restricted share units convert to defer is invested into a restricted stock unit account with dividends credited to the directors’ share equivalent unit account.units upon lapse of the two year restriction period. The amounts deferred, dividend equivalents and any appreciation or accrued interest are paid in cash (if annual retainer was deferred in the deferred cash account) or in our common shares, as applicable, upon a director’s retirement from the Board. We do not pay above market rates or preferential rates under this deferred compensation plan.Board in predetermined quarterly installments over a four year period.
Share Ownership Guidelines. The Board strongly believes that our non-employee directors should have a meaningful ownership interest in the Company and has implemented share ownership guidelines for our non-employee directors. The ownership guidelines require non-employee directors to own a minimum of five times their annual cash retainer in common shares (shares held in the form of stock equivalent units or restricted share units qualify as shares owned under the guidelines). Newly elected directors have five years within which to achieve the share ownership requirement.
Charitable Gifts Matching Program. Current and retired non-employee directors may participate in our employee matching gift program that is available to all current and retired employees involving contributions of cash or publicly-traded stock made to cultural, educational, social, medical or health-related charitable organizations that are exempt from federal income tax.employees. Messrs. Banks, George, Keithley, Madar, Merriman,Richey and Robinson and Rosen, Ms. Puma and Dr. Ignat participated in this program in Fiscal Year 2011.fiscal year 2013. We made matching contributions totaling $52,750 during Fiscal Year 2011.$44,500 for our directors who served in fiscal year 2013.
21
Indemnity Agreements. We have indemnification agreements for directors in order to attract and retain the most capable persons reasonably availablehighly qualified candidates to serve as our directors. The indemnification agreements are intended to secure the protection for our directors contemplated by our Regulations and Ohio law.
Each indemnification agreement provides, among other things, that we will, subject to the agreement terms, indemnify a director if by reason of their service they incur losses, liabilities, judgments, fines, penalties, or amounts paid in settlement in connection with any threatened, pending, or completed proceeding, whether of a civil, criminal, administrative, or investigative nature. A director will not be indemnified where a director is adjudicated to have brought about or materially contributed to a claim as a consequence of a director’s dishonesty. In addition, each indemnification agreement provides for the advancement of expenses incurred by a director, subject to certain exceptions, in connection with proceedings covered by the indemnification agreement.
This description of the director indemnification agreements is not complete and is qualified in its entirety by reference to the full text of the Form of Director Indemnification Agreement between us and each director, filed as Exhibit 10-c to our Form 10-K for the year ended October 31, 2011.extent permitted by Ohio law.
Director Compensation Table for Fiscal Year 20112013
The following table sets forth the total compensation paid to each non-employee director for services provided as a director for Fiscal Year 2011. All information regarding stock awards have been adjusted to reflect the two-for-one stock split paid to shareholders on April 12, 2011.fiscal year 2013.
Name (1) | Fees Earned or Paid in Cash (2) (3) $ | Stock Awards (4) $ | All Other Compen- sation (5) $ | Total $ | Fees Earned or Paid in Cash (2) (3) $ | Stock Awards (4) $ | All Other Compensation (5) $ | Total $ | ||||||||||||||||||||||||
Lee C. Banks | 60,000 | 80,000 | 6,668 | 146,668 | 60,000 | 110,000 | 8,560 | 178,560 | ||||||||||||||||||||||||
Randolph W. Carson | 60,000 | 80,000 | 4,034 | 144,034 | 60,000 | 110,000 | 7,023 | 177,023 | ||||||||||||||||||||||||
David W. Ignat | 60,000 | 80,000 | 23,481 | 163,481 | ||||||||||||||||||||||||||||
Arthur L. George, Jr. | 60,000 | 110,000 | 6,009 | 176,009 | ||||||||||||||||||||||||||||
Frank M. Jaehnert | 60,000 | 110,000 | 1,621 | 171,621 | ||||||||||||||||||||||||||||
Joseph P. Keithley | 110,000 | 80,000 | 20,839 | 210,839 | 110,000 | 110,000 | 35,376 | 255,376 | ||||||||||||||||||||||||
William P. Madar (6) | 58,375 | 73,635 | 30,384 | 162,394 | ||||||||||||||||||||||||||||
Michael J. Merriman, Jr. | 66,675 | 80,000 | 25,697 | 172,372 | 72,000 | 110,000 | 21,438 | 203,438 | ||||||||||||||||||||||||
Mary G. Puma | 67,500 | 80,000 | 9,160 | 156,660 | 70,000 | 110,000 | 14,027 | 194,027 | ||||||||||||||||||||||||
Victor L. Richey, Jr. | 60,000 | 80,000 | 1,677 | 141,677 | 63,333 | 110,000 | 12,756 | 186,089 | ||||||||||||||||||||||||
William L. Robinson | 63,333 | 80,000 | 21,735 | 165,068 | 31,667 | 110,000 | 31,333 | 173,000 | ||||||||||||||||||||||||
Benedict P. Rosen | 21,667 | 26,682 | 24,818 | 73,167 | ||||||||||||||||||||||||||||
| (1) | Mr. Hilton, our President and Chief Executive Officer, is not included in this table because he is |
| (2) | Mr. |
2224
| (3) | The following table represents the |
Director | Amount of Cash Retainer | Deferred to Share Equivalent Unit Account ($) | ||||||
Lee C. Banks | — | |||||||
Randolph W. Carson | — | |||||||
Arthur L. George, Jr. | ||||||||
David W. Ignat | ||||||||
Frank M. Jaehnert | ||||||||
Joseph P. Keithley | ||||||||
| — | |||||||
Michael J. Merriman, Jr. | — | |||||||
Mary G. Puma | — | |||||||
Victor L. Richey, Jr. | — | |||||||
William L. Robinson | ||||||||
| ||||||||
| (4) | This column represents the grant date fair value of the restricted share award as calculated under FASB ASC Topic |
Director | Restricted Shares (#) | Restricted Share Units (#) | ||||||
Lee C. Banks | — | |||||||
Randolph W. Carson | ||||||||
| — | |||||||
Frank M. Jaehnert | �� | 1,787 | — | |||||
Joseph P. Keithley | — | |||||||
| ||||||||
Michael J. Merriman, Jr. | — | |||||||
Mary G. Puma | — | |||||||
Victor L. Richey, Jr. | ||||||||
William L. Robinson | — | |||||||
| ||||||||
| (5) | This column |
| ||||
| ||||
| ||||
| ||||
| ||||
| ||||
| ||||
| ||||
| ||||
| ||||
| ||||
2325
PROPOSAL 2: RATIFY THE APPOINTMENT OF INDEPENDENT
REGISTERED PUBLIC ACCOUNTING FIRM
Appointment of Independent Registered Public Accounting Firm for Fiscal Year Ending October 31, 20122014
Ernst & Young LLP (“Ernst & Young”) served as our independent registered public accounting firm for the Fiscal Yearfiscal year ended October 31, 2011.2013. The Audit Committee has appointed Ernst & Young to serve as our auditors for the Fiscal Yearfiscal year ending October 31, 2012.2014. Although shareholder ratification of the appointment of Ernst & Young is not required, the Board of Directors believes that submitting the appointment to our shareholders for ratification is a matter of good corporate governance. If our shareholders do not ratify the appointment of Ernst & Young, the Audit Committee will reconsider the appointment. We expect that a representative of Ernst & Young will be present at the 2012 Annual Meeting to respond to appropriate questions from shareholders and to make a statement if he or she desires to do so.
As provided in the Audit Committee’s charter, the Audit Committee is responsible for directly appointing, retaining, terminating and overseeing our independent registered public accounting firm. While we have a long-standing relationship with Ernst & Young, theOur Audit Committee continuously evaluates the independence and effectiveness of Ernst & Young and its personnel, and the cost and quality of its audit and audit-related services.
Pre-Approval of Audit and Non-Audit Services
At the start of each fiscal year, our Audit Committee pre-approves the audit services and audit-related services, if any, together with specific details regarding such services anticipated to bebeing required for such fiscal year including, as available, estimated fees. The Audit Committee reviews the services provided to date and actual fees against the estimates and such fee amounts may be updated for presentation at the regularly scheduled meetings of the Audit Committee. Additional pre-approval is required before actual fees for any service can exceed the originally pre-approved amount. The Audit Committee may also revise the list of pre-approved services and related fees from time to time. All of the services described below under the captions “Audit Fees” and “Audit-Related Fees” with respect to Fiscal Years 2010fiscal years 2012 and 20112013 were approved in accordance with this policy.
If we seek to engage our independent registered public accounting firm for other services that are not considered subject to general approval as described above, then the Audit Committee must approve such specific engagement as well as the estimated fees. Such engagement will be presented to the Audit Committee for approval at its next regularly scheduled meeting. If the timing of the project requires an expedited decision, then we may ask the chairperson of the Audit Committee to approve such engagement. Any such approval by the chairperson is then reported to the full Audit Committee for ratification at the next Audit Committee meeting. In any event, approval of any engagement by the Audit Committee or the chairperson of the Audit Committee is required before our independent registered public accounting firm may commence any engagement. Additional approval is required before any fees can exceed approved fees for any such specifically-approved services.
Fees Paid to Ernst & Young
The following table shows the fees we paid or accrued for audit and other services provided by Ernst & Young for the Fiscal Yearsfiscal years ended October 31, 20112013 and October 31, 2010:2012:
| Fiscal Year 2011 | Fiscal Year 2010 | Fiscal Year 2013 | Fiscal Year 2012 | |||||||||||||
Audit Fees (1) | $ | 1,308,375 | $ | 1,262,945 | $ | 1,440,833 | $ | 1,384,266 | ||||||||
Audit-Related Fees (2) | $ | — | $ | — | $ | 87,500 | $ | 263,000 | ||||||||
| (1) | Audit services of Ernst & Young consisted of the audit of our annual consolidated financial statements, the quarterly review of interim financial statements, the audit of |
24
| (2) | Audit-Related Fees generally include fees for employee benefit plans, business acquisitions, accounting consultations and services related to |
Required Vote
The affirmative vote of a majority of the shares represented at the 2012 Annual Meeting of Shareholders and entitled to vote on this proposal will be required to ratify the Audit Committee’s appointment of our independent registered public accounting firm. A proxy/voting instruction card marked as abstaining with respect to this proposal will have the effect of a vote against ratification of the appointment of the independent registered public accounting firm.
26
RECOMMENDATION REGARDING PROPOSAL 2:
THE BOARD OF DIRECTORS RECOMMENDS THAT YOU VOTE
“FOR” RATIFICATION OF THE
AUDIT COMMITTEE’S APPOINTMENT OF ERNST & YOUNG LLP AS OUR INDEPENDENT
REGISTERED PUBLIC ACCOUNTING FIRM FOR THE FISCAL YEAR ENDING
OCTOBER 31, 2012.2014.
25
SECURITY OWNERSHIP OF NORDSON COMMON SHARES BY DIRECTORS, EXECUTIVE OFFICERS AND LARGE BENEFICIAL OWNERS
The following table shows the number of Nordson common shares beneficially owned as of January 3, 2012the record date by (1) each person who was a director as of October 31, 2011,2013; (2) each executive officer named in this Proxy Statement and (3) by all executive officers and directors as a group. No executive officer or director owns more than 4.2%0.37% of outstanding Nordson common shares. All executive officers and directors as a group own approximately 5.3%1.7% of outstanding Nordson common shares. There were 65,187,88164,300,002 shares outstanding as of January 3, 2012.the record date.
This beneficial ownership information is based on information furnished by the directors and executive officers. Beneficial ownership is determined in accordance with Rule 13d-3 under the Securities Exchange Act of 1934 for purposes of this Proxy Statement and is not necessarily to be construed as beneficial ownership for other purposes.
Name of Beneficial Owner | Total | Percent | Direct Ownership (1) | Employee Plan (2) | Right to Acquire (3) | Share Equivalent Units (4) | Total | Percent | Direct Ownership (1) | Employee Plan (2) | Right to Acquire (3) | Restricted Share Units and Share Equivalent Units (4) | ||||||||||||||||||||||||||||||||||||
Lee C. Banks | 5,825 | * | 5,825 | — | — | — | 9,144 | * | 7,612 | — | — | 1,532 | ||||||||||||||||||||||||||||||||||||
Randolph W. Carson | 15,148 | * | 7,164 | — | — | 7,984 | 19,793 | * | 8,951 | — | — | 10,842 | ||||||||||||||||||||||||||||||||||||
Dr. David W. Ignat (5) | 2,705,617 | 4.15 | 2,677,897 | — | 27,720 | — | ||||||||||||||||||||||||||||||||||||||||||
Arthur L. George, Jr. | 6,068 | * | 4,536 | — | — | 1,532 | ||||||||||||||||||||||||||||||||||||||||||
Frank M. Jaehnert | 6,101 | * | 3,086 | — | — | 3,015 | ||||||||||||||||||||||||||||||||||||||||||
Joseph P. Keithley | 42,618 | * | 6,518 | — | — | 36,100 | 41,657 | * | 1,518 | — | — | 40,139 | ||||||||||||||||||||||||||||||||||||
Michael J. Merriman, Jr. | 12,618 | * | 2,701 | — | — | 9,917 | 16,147 | * | 2,701 | — | — | 13,446 | ||||||||||||||||||||||||||||||||||||
Mary G. Puma | 42,666 | * | 20,265 | — | 20,104 | 2,297 | 35,926 | * | 22,052 | — | 10,000 | 3,874 | ||||||||||||||||||||||||||||||||||||
Victor L. Richey, Jr. | 5,858 | * | 1,848 | — | — | 4,010 | 8,347 | * | 924 | — | — | 7,423 | ||||||||||||||||||||||||||||||||||||
William L. Robinson | 48,532 | * | 9,560 | — | — | 38,972 | ||||||||||||||||||||||||||||||||||||||||||
Michael F. Hilton | 71,908 | * | 24,799 | — | 47,109 | — | 238,881 | * | 30,933 | — | �� | 163,663 | 44,285 | |||||||||||||||||||||||||||||||||||
Douglas C. Bloomfield | 75,645 | * | 6,725 | 7,616 | 47,150 | 14,154 | ||||||||||||||||||||||||||||||||||||||||||
John J. Keane | 130,224 | * | 45,573 | 840 | 72,750 | 11,061 | 151,986 | * | 29,817 | 851 | 110,075 | 11,243 | ||||||||||||||||||||||||||||||||||||
Peter G. Lambert | 39,529 | * | 15,035 | 1,444 | 23,050 | — | 71,458 | * | 22,487 | 1,346 | 47,625 | — | ||||||||||||||||||||||||||||||||||||
Gregory P. Merk | 117,589 | * | 27,295 | 44 | 90,250 | — | ||||||||||||||||||||||||||||||||||||||||||
Gregory A. Thaxton | 48,708 | * | 8,192 | 5,537 | 29,350 | 5,629 | 95,523 | * | 9,798 | 9,798 | 54,950 | 25,194 | ||||||||||||||||||||||||||||||||||||
All Executive Officers and Directors as a Group (16 people) | 3,432,330 | 5.2 | 2,864,423 | 25,841 | 407,183 | 134,882 | ||||||||||||||||||||||||||||||||||||||||||
All Executive Officers and Directors as a Group (17 people) | 1,104,889 | 1.7 | % | 226,215 | 17,850 | 641,933 | 218,891 | |||||||||||||||||||||||||||||||||||||||||
| * | Less than 1% |
| (1) | Except as otherwise stated, beneficial ownership of the shares held by each of the directors and executive officers consists of sole voting power |
| (2) | This column shows indirect shares held in our Employee Stock Ownership Plan and 401(k) Plan, for which the individuals indicated have sole voting power and limited investment power. |
| (3) | This column shows shares covered by stock options that currently are exercisable or will be exercisable by |
| (4) | This column shows the direct share ownership held by directors and executive officers under various deferred compensation plans described in this Proxy Statement. |
2627
Five Percent Beneficial Owners
The following table lists each person we know to be an owner of more than 5% of our common shares as of January 3, 2012.the record date.
Name and Address of Beneficial Owner | Amount and Nature of Beneficial Ownership | Percent | ||||||
Columbia Wanger Asset Management LLC (1) | 4,852,400 | 7.4 | ||||||
227 West Monroe Street — Suite 3000 Chicago, IL 60606-5055 | ||||||||
KeyCorp (2) | 4,315,278 | 6.6 | ||||||
127 Public Square, Cleveland, OH 44144-1306 | ||||||||
Jennifer Savage (3) | 4,149,761 | 6.4 | ||||||
3900 Key Center, 127 Public Square, Cleveland, OH 44114-1291 | ||||||||
Fidelity Management and Research Co. (4) | 3,946,614 | 6.1 | ||||||
245 Summer Street, Boston, Massachusetts, 02210-1133 | ||||||||
Neuberger Berman LLC (5) | 3,521,443 | 5.4 | ||||||
605 Third Avenue, 39(th) Floor New York, NY 10158-3698 | ||||||||
Jane B. Nord (6) | 3,282,597 | 5.0 | ||||||
P.O. Box 457, Oberlin, OH 44074 | ||||||||
Name and Address of Beneficial Owner | Amount and Nature of Beneficial Ownership | Percent | ||||||
Columbia Wanger Asset Management, LLC (1) | 5,229,500 | 8.1 | % | |||||
227 West Monroe Street — Suite 3000 Chicago, IL 60606-5055 | ||||||||
Jane B. Nord (2) | 3,948,809 | 6.1 | % | |||||
P.O. Box 457, Oberlin, OH 44074 | ||||||||
BlackRock, Inc. (3) | 3,402,263 | 5.3 | % | |||||
40 East 52nd Street, New York, NY 10022 | ||||||||
Neuberger Berman Group LLC (4) | 3,429,812 | 5.3 | % | |||||
605 Third Avenue, New York, NY 10158 | ||||||||
| (1) |
| (2) |
| (3) | In its most recent Schedule 13G/A filed January 30, 2013 with the SEC, BlackRock, Inc. stated that it is a parent holding company or control person, reported beneficial ownership of 3,402,263 shares and stated that it has sole voting power over all of the reported shares and sole investment power over all of the reported shares. |
| (4) | In the most recent Schedule 13G/A filed on February 14, 2013 with the SEC, Neuberger Berman Group LLC and Neuberger Berman LLC reported beneficial ownership of 3,429,812 shares and stated that the entities have shared voting power over 3,352,900 of the reported shares and shared investment power over all of the reported shares. The filing stated that Neuberger Berman Management LLC has shared voting and shared investment power over 2,991,952 of the reported shares and Neuberger Berman Equity Funds has shared voting and shared investment power over 2,626,508 of the reported shares. According to the Schedule 13G/A, Neuberger Berman Group LLC, Neuberger Berman LLC, Neuberger Berman Management LLC and certain affiliated persons own directly no shares. As investment advisers, certain affiliated persons that are controlled by Neuberger Berman Group LLC have investment and voting powers with respect to the shares held. |
According to the Schedule 13G/A, Neuberger Berman Group LLC, through its direct and indirect subsidiary Neuberger Berman Holdings LLC, controls Neuberger Berman LLC and certain affiliated persons. Each of January 3, 2012, approximately 30%Neuberger Berman Group LLC, Neuberger Berman LLC, Neuberger Berman Management LLC and certain affiliated persons disclaim beneficial ownership of our outstanding shares are held directly or indirectly by present and former directors, officers and employees and their families, the Nord and Ignat families and the Nord Family Foundation. reported shares.
We are party to an agreement that, with some exceptions, gives us a right of first refusal with respect to proposed sales of our common shares by certain members of the Nord family and The Nord Family Foundation.
27
Section 16(a) Beneficial Ownership Reporting Compliance
Section 16(a) of the Securities Exchange Act of 1934 requires our directors and executive officers and persons who own more than ten percent of our common shares to file reports of ownership and changes in ownership of our common shares held by them with the Securities and Exchange Commission.SEC. Copies of these reports must also be provided to us.
Based on our review of these reports, we believe that, during the Fiscal Yearfiscal year ended October 31, 2011,2013, all reports were filed on a timely basis by reporting persons.
28
PROPOSAL 3 — ADVISORY VOTE ONTO APPROVE NAMED EXECUTIVE OFFICER COMPENSATION
At our 20112013 Annual Meeting, we asked our shareholders to approve, on an advisory basis, compensation of Shareholders, approximately 94% of theour named executive officers, commonly referred to as a “say-on-pay” vote. Our shareholders who voted on the “say-on-pay” proposaloverwhelmingly approved the compensation we pay toof our named executive officers. The Compensation Committee, which is composed exclusivelyofficers, with approximately 97% of independent directors, believesshareholder votes cast in favor of our proposal. We value this positive endorsement by our shareholders of our executive compensation policies and believe that the shareholder vote confirms the philosophy and objectivesoutcome signals our shareholders’ support of our executive compensation program. As a result, our Compensation Committee decided to retain our general approach to named executive officer compensation, with an emphasis on short and long-term incentive compensation that rewards our most senior executives when they deliver value for our long-term shareholders.
With respect to the advisory shareholder vote on how frequently we should seek an advisory vote on compensation paid to our named executive compensation,officers, our Board recommended, and shareholders expressed overwhelming support for, an annual frequency. Therefore, consistent with this vote, we are conducting an annual, non-binding advisory vote on the compensation of our named executive officers as disclosed in this Proxy Statement in accordance withas required by Section 14A of the Securities and Exchange Commission’s rules.Act.
Our executive compensation program is designed to attract, motivate, and retain executive talent. Under this program our executive officers, including the named executive officers, are rewarded for increasing shareholder value and for the achievement of specific short-term, long-term and strategic goals. We invite you to read the “Compensation“Compensation Discussion and Analysis”in this Proxy Statement for additional details about our executive compensation program, including information about the compensation of our named executive officers for Fiscal Year 2011.fiscal year 2013.
Nordson’s long and consistent long-term shareholder value creation over time is attributed to a rigorously-applied management process implemented over the years by successive teams of talented and committed executives. Our executive compensation program underpins and reinforces this process and the performance it generates. We believe the program strikes the appropriate balance between utilizing responsible, measured pay practices and effectively incentivizing our executives to dedicate themselves fully to creating value creation for our shareholders.
In support of this belief and reflective of the Compensation Committee’s diligent oversight of the executive compensation program, the Compensation Committee urges you to consider the following factors:
weWe provide a significant portion of total direct compensation in the form of performance-based incentives, including performance shares;shares.
weWe establish total direct compensation such that, when our fundamental financial performance is at target levels, total direct compensation (base salary, annual cash incentives, and long-term incentives) paid to our named executive officers approximates the median total target direct compensation for executives in comparable positions at companies in our peer group;group.
Annual and long-term incentive compensation is earned based primarily upon consistent and transparent performance metrics derived directly from our publicly filed financial statements prepared in addition to the Annual Cash Incentive Plan, we have aaccordance with generally accepted accounting principles. The Compensation Committee confirms performance based upon pre-established and measurable metrics before any incentive plan payouts are made.
Our Long-Term Incentive Plan, with share-based payouts at the end of a three-year performance period, which rewards sustainable growth and profitability;profitability.
we confirm performance based upon pre-established and measurable metrics before any incentive plan payouts are made;
payoutsPayouts made under our Annual Cash Incentive Plan and the Long-Term Incentive Plan are intended to qualify as performance-based compensation under Section 162(m) of the Internal Revenue Code and be deductible for tax purposes;purposes.
29
ourOur shareholder-approved incentive compensation plans incorporate maximum award levels that limit the payouts that can be made to our named executive officers;officers.
equityThe Compensation Committee is advised by an independent compensation consulting firm.
Equity grants are made on a consistent schedule and are not made in anticipation of significant developments that may impact the price of our common shares. Similarly, we do not time the release of material, non-public information based on equity grant dates;dates.
weWe evaluate share utilization by reviewing ongoing grants, forfeitures, overhang levels (dilutive impact of equity compensation on our shareholders), and annual run rates (the aggregate shares awarded as a percentage of total outstanding shares).
We provide only modest perquisites that benefit the Company’s business;business.
29
weWe do not pay above-market or preferential earnings on non-qualified deferred compensation;compensation.
we do not repriceWe prohibit repricing of underwater stock options;options and other awards without shareholder approval.
weWe have share ownership guidelines that require our Chief Executive Officer to own Nordson common shares equal to 5 times annual base salary and our other executive officers to own Nordson common shares equal to 2-3 times annual base salary;salary.
weWe have an incentive compensation forfeiture and profit recapture (“clawback”) termspolicy that accompany stock option grants; andis broader in its reach than that imposed by Section 304 of the Sarbanes-Oxley Act.
We prohibit directors and executive officers from pledging Nordson common shares as partcollateral. Also prohibited is trading in derivative securities of Nordson’s common shares, engaging in short sales of Nordson securities, or purchasing any other financial instruments (including prepaid variable forward contracts, equity swaps, collars and exchange funds) that are designed to hedge or offset any decrease in the processmarket value of establishing compensation and determining incentive plan payouts, weany Nordson securities.
We engage in an ongoing, rigorous review of executive talent and succession plans for key corporate roles.
We are asking our shareholders to indicate their support for compensation paid to our named executive officers as described in this Proxy Statement by voting “FOR” the following resolution at the 2014 Annual Meeting:
“RESOLVED, that the Company’s shareholders approve, on a non-binding advisory basis, the compensation of the named executive officers, as disclosed in the Company’s Proxy Statement for the 20122014 Annual Meeting of Shareholders pursuant to the compensation disclosure rules of the Securities and Exchange Commission, including the Compensation Discussion and Analysis, the executive compensation tables, and the related narrative.”
While the vote on compensation is non-binding, our Board of Directors and our Compensation Committee strongly value the opinions of our shareholders. The Compensation Committee will consider the outcome of the vote when evaluating the effectiveness of the compensation paid to our named executive officers.
RECOMMENDATION REGARDING PROPOSAL 3:
THE BOARD OF DIRECTORS UNANIMOUSLY RECOMMENDS THAT YOU VOTE
“FOR” THE APPROVAL (ON AN ADVISORY, NON-BINDING BASIS)
OF THE COMPENSATION OF OUR NAMED EXECUTIVE COMPENSATION.OFFICERS
AS DISCLOSED IN THIS PROXY STATEMENT.
30
COMPENSATION DISCUSSION AND ANALYSIS
All references in this section to years are references to fiscal years unless otherwise noted. Our fiscal year ends October 31.
This Compensation Discussion and Analysis (“CD&A”) describes our executive compensation philosophy and program, the compensation decisions made under this program and the specific factors we considered in making those decisions. This CD&A focuses on the compensation of our “named executive officers” for 2013, who were:
Name | Title | |
Michael F. Hilton | President and Chief Executive Officer | |
Gregory A. Thaxton | Senior Vice President, Chief Financial Officer | |
John J. Keane | Senior Vice President | |
Peter G. Lambert | Senior Vice President | |
Gregory P. Merk1 | Senior Vice President |
| 1 | Mr. Merk was promoted to Senior Vice President effective May 1, 2013. |
This Compensation Discussion and Analysis is presented in four parts:
Part I: IntroductionExecutive Summary and 20112013 Highlights. In this section we discuss our pay-for-performance philosophy and highlight practices that support this philosophy. We also provide an overview of the components of the executive compensation program and highlight our financial and operating performance that supported compensation awarded to our named executive officers for Fiscal Year 2011.2013.
Part II: Objectives and Components of Our Executive Compensation Program; Analysis of Compensation Decisions for Fiscal Year 20112013. In this section we explain the objectives of our compensation program, discuss our compensation process and procedures, and provide details of the components and elements of the compensation we provide to our named executive officers. We also discuss and analyze actions taken with respect to compensation paid to our named executive officers for Fiscal Year 2011.2013.
Part III: Compensation Committee Actions Related to Fiscal Year 20122014 Executive Compensation. In this section we discuss briefly actions taken with respect to compensation of our named executive officers for Fiscal Year 2012, which commenced November 1, 2011.2014.
Part IV: Policies Related to Executive Compensation. In this section we review the policies we have adopted that relate to our executive compensation program —– equity grant practices (including forfeitureour newly enhanced and “clawbacks”expanded clawback policy and the prohibition against pledging shares or engaging in the hedging of stock option grants)Nordson common shares), shareholder ownership guidelines for executive officers and tax and accounting considerations.
Our named executive officers during Fiscal Year 2011 were:
|
| |
| ||
| ||
| ||
| ||
|
Mr. Thaxton was promoted to Senior Vice President, Chief Financial Officer effective December 2, 2011.
We use the terms “the Committee,” “we,” “us,” and “our” interchangeably in reference to the Compensation Committee, or in the proper context, Nordson Corporation. In this Compensation Discussion and Analysis, all references to a year is intended to mean “fiscal year” unless otherwise indicated.
On March 1, 2011, our Board of Directors declared a two-for-one stock split of our common shares payable in the form of a 100% stock dividend. Accordingly, share prices, earnings per share measures and results, the numbers of all shares and share units and other equity-based amounts usedCorporation, in this Compensation Discussion and Analysis have been adjusted from previous proxy statements to reflect the stock split.Analysis.
This Compensation Discussion and Analysis discloses future company performance measures and goals. You should read and understand these measures and goals only as they relate to our executive compensation program. We are not providing these measures and goals as guidance or as statements of management’s expectations or estimates of our current or future results. We refer you to our Annual Report on Form 10-K for the year ended October 31, 20112013 for additional information regarding Fiscal Year 20112013 financial results discussed in this Compensation Discussion and Analysis.
31
PART I: INTRODUCTIONEXECUTIVE SUMMARY AND 20112013 HIGHLIGHTS
Nordson is a performance-driven, financially and operationally focused company that has a long track record of delivering increased value to our shareholders. Continuity, stability, and rigorous execution of our business plans, combined with a continuous drive to develop innovative solutions for our customers, are hallmarks of our management team and management processes.
Our executive compensation programs reflectprogram reflects a balanced approach to incentivizing and rewarding performance by combining a competitive market-basedmarket-driven base salary with annual and long-term incentive and equity compensation. We have designed our executive compensation program to reward performance that creates long-term shareholder value; e.g.,value – performance that results in sustainable growth, superior returns through disciplined capital investment, sustainable cost reduction, and consistent operational excellence while taking an appropriate level of risk, asrisk. Our approach is further explained in the “Risks Related to Executive Compensation Policies and Practices” section offollowing this Proxy Statement.CD&A. We use performance goals which are marked to pre-established specific growth measures each year; a long-term orientation of the compensation mix; a substantial linkage of executive officer compensation to long-term share performance; total direct compensation opportunities targeted at the median of our peer group, with performance driving actual pay delivered; and consistency in administration of our executive officer compensation plans.
Executive Summary2013 Highlights
Operating and Corporate Financial Performance
Fiscal year 2013 was a year of Nordson’s Executive Compensation Programsolid financial results in the face of a lackluster global economic recovery. Despite these negative external factors, we delivered a total shareholder return of 23% in 2013. Our ability to execute on all facets of the 2013 operating plan is reflected in the following benchmarks being achieved:
The following provides
Sales grew to a record $1.54 billion, an overviewincrease of our compensation philosophy9.5% from a year ago;
Gross margin was 56%, a continued strong level;
Operating profit was $324 million and programs:operating margin was very solid at 21%;
Net income was $222 million, and EPS was $3.42 per share;
| • | We generated free cash flow before dividends of $225 million(1); |
We considerincreased our quarterly dividend by 20%, marking the results of the annual advisory vote on executive compensation, noting the strong support expressed by50th consecutive year we have increased our shareholders for our executive compensation program at the 2011 Annual Meeting of Shareholders.dividend; and
We believe inpay-for-performanceOver the past three years we have purchased 7.8% of Nordson’s outstanding shares at an average price of $47.16 per share, a discount of approximately 34.6% compared to the 2013 year-end closing price of $72.09 per share.
| (1) | “Free cash flow” is determined from our consolidated statement of cash flows and represents $268 million of net cash provided by operating activities minus $47 million of additions to property, plant, and equipment plus $4 million of proceeds from the sale of property, plant, and equipment. |
In addition, our shareholders approved the 2012 Stock Incentive and Award Plan (“2012 Plan”). The program emphasizesvariable incentive award opportunities which2012 Plan contains a number of features that are payabledesigned to further our pay-for-performance philosophy, protect the interests of the Company and its shareholders, and conform to best practices. For example, the 2012 Plan:
Eliminates the “evergreen” provision under our prior equity plan, thus eliminating the automatic annual increase in the number of shares available for stock awards.
| • | Requires minimum vesting periods for “full value” awards (e.g., restricted shares, restricted share units and other share-based awards), with time-based awards generally subject to a minimum vesting period of three years and performance based awards generally subject to a minimum performance period of one year. |
Prohibits the repricing of stock options or stock appreciation rights without shareholder approval, except for adjustments made in connection with certain corporate transactions.
32
Provides that dividends and dividend equivalents on performance-based awards will be paid only if specified financial, operationalon a deferred and personal goals are achieved.contingent basis, subject to achievement of the applicable performance goals.
Our compensation program is designedRequires that stock options granted under the 2012 Plan have an exercise price at least equal toattract, motivate, reward and retain the most talented executiveswho can drive business performance.fair market value of the underlying shares on the date of grant.
Authorizes the Compensation Committee to grant awards that are intended to qualify for the performance-based compensation exemption from the limitation on corporate tax deductions under Section 162(m) of the Internal Revenue Code.
The 2014 annual cash incentive and long-term incentive awards (stock options, restricted shares and performance share units) were granted under the 2012 Plan.
How Incentive Compensation Paid Out was Tied to the Company’s Performance in 2013
Our 2013 results provided us with an opportunity to further establish that our pay-for-performance philosophy works as intended, with incentive pay being driven by performance in the following elements comprise theways:
total direct compensation awarded2013 Annual Cash Incentive Payout. toThe annual incentive payout for each of our named executive officers: base salary, performance-based annual cash incentive award, and equity-based long term incentive awards consistingofficers ranged from 69% - 100% of target, with below target payouts driven by specific business unit performance results. From a corporate perspective, we exceeded the maximum level of performance shares, stock options and restricted stock.for the return on capital measure but did not reach threshold performance for consideration of a payout under the earnings per share measure.
We emphasize2011-2013 Long-Term Performance Incentive Payout. For our long-term incentive plan for the 2011-2013 performance period, we exceeded the maximum level of performance for each financial measure – cumulative revenue and cumulative earnings per share ownership. Long-term incentive awards are delivered as equity based awards to our named executive officers, who are required to maintain minimum share ownership levels– resulting in Nordson common shares ranging from two times to five times their annual base salary.a payout of 200% of target.
We setThe following tables illustrate the elementsspecific financial measures that drove the corporate performance factors of the compensation program for our named executive officers to provide total direct compensation opportunity at or near themedian range of our peer group. Actualand payouts can be above or belowunder the median based on corporate, business segment and personal performance.
Our executives are offeredvery modest perquisites which are provided to facilitate focused performance on their jobs.
The Compensation Committee exercises discretion in determining compensation actions when necessary due to extraordinary changes in the economy, unusual events or overall company performance.
“Pay-for-Performance” – Structure, Key Financial Measures and Impact on Compensation Payouts
Our executive compensation program is structured to ensure that a significant portion of the compensation paid to our named executive officers is dependent upon the performance of our
32
business. This “pay-for-performance” structure drives the effort to achieve our short- and long-term objectives. The program is also structured to ensure that it is not overly weighted toward annual cash incentive compensationplan (diluted earnings per share and does not otherwise have the potential to threaten long-term shareholder value by promoting unnecessary or excessive risk-taking by our named executive officers. The “Allocation of Executive Compensation” section in Part II of this Compensation Discussionreturn on capital) and Analysis describes our policies and practices for allocating compensation of our named executive officers among the various categories and elements of compensation.
As described in the following table, we provide the variable elements of our executive compensation program — annual cash incentive compensation, long-term incentive compensationplan – cumulative diluted earnings per share and equity-based compensation — to primarily encourage and reward performance that implements and advances our strategies and goals relating to financial performance and profitablecumulative revenue growth for the very essence of our “pay-for-performance” philosophy.last three fiscal years:
Annual Incentive Plan | 2011 | 2012 | 2013 | |||||||||
Diluted Earnings Per Share | $3.25 | $3.45 | $3.42 | |||||||||
Return on Capital | 34.6% | 22.8% | 17.6% | |||||||||
Long-Term Incentive Plan | 2009-2011 | 2010-2012 | 2011-2013 | |||||||||
Cumulative Diluted Earnings Per Share(1) | $ | 6.71 | $ | 9.00 | $ | 10.12 | ||||||
Cumulative Revenue (000’s) | $ | 3,093,875 | $ | 3,684,288 | $ | 4,185,658 | ||||||
| (1) |
|
| |
|
| |||
|
| |||
|
|
33
Below in graphic presentation is a depiction of the elements of our executive compensation program. A detailed discussion of these elements is found under the caption “Summary Table — Components of Our Executive Compensation Program” in Part II of this Compensation Discussion and Analysis.
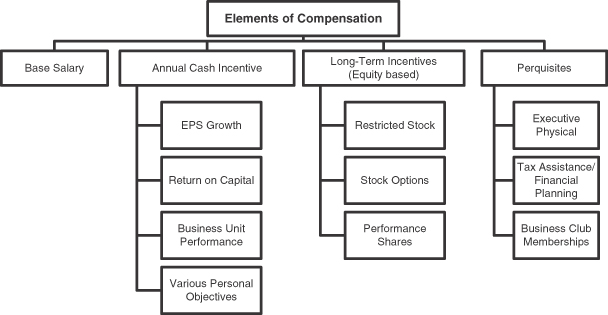
2011 Highlights
Corporate Financial
Our strong financial and operational performance in 2011 was a result of an improved global economy and, more importantly, our ability to execute on all facets of our 2011 operating plan, as reflected in the corporate financial measures of the quantitative performance factor of the Annual Cash Incentive Plan — our diluted earnings per share and return on capital — and revenue growth, the latter being a component of the long-term incentive plan payout:
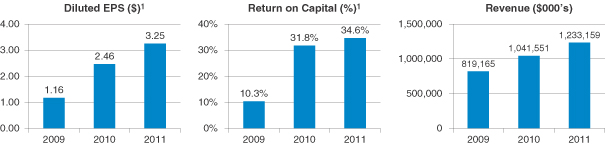
34
In addition to thesethis financial highlights,performance, the graph below compares Nordson’s total shareholder return for the five year period ending October 31, 20112013 with that of the S&P 500 Industrial Machinery Index, the S&P MidCap 400 Index, S&P 500 Industrial Machinery Index and the S&P MidCap 400 Industrial Machinery Index, and the median return of our peer group companies (assuming the reinvestment of all dividends):
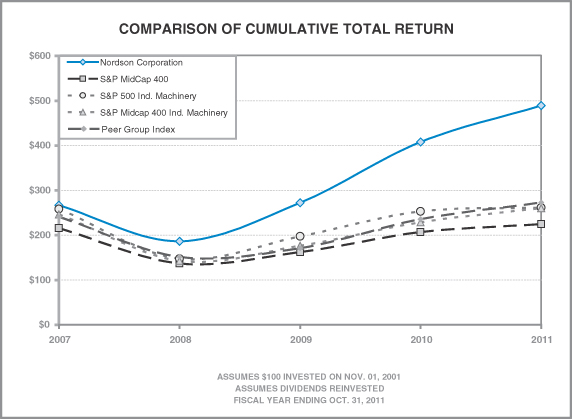
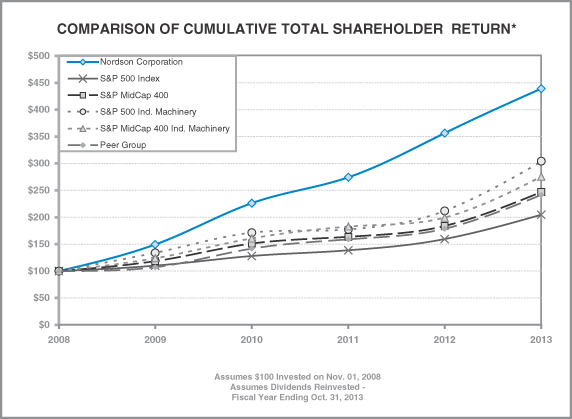
Company/Market/Peer Group | 2008 | 2009 | 2010 | 2011 | 2012 | 2013 | ||||||||||||||||||
Nordson Corporation | $ | 100.00 | $ | 149.23 | $ | 226.27 | $ | 274.10 | $ | 356.22 | $ | 439.17 | ||||||||||||
S&P 500 Index | $ | 100.00 | $ | 109.80 | $ | 127.94 | $ | 138.29 | $ | 159.32 | $ | 204.36 | ||||||||||||
S&P MidCap 400 | $ | 100.00 | $ | 118.18 | $ | 150.84 | $ | 163.74 | $ | 183.56 | $ | 247.03 | ||||||||||||
S&P 500 Ind. Machinery | $ | 100.00 | $ | 133.81 | $ | 171.21 | $ | 177.14 | $ | 211.99 | $ | 303.42 | ||||||||||||
S&P MidCap 400 Ind. Machinery | $ | 100.00 | $ | 123.56 | $ | 160.59 | $ | 182.65 | $ | 199.48 | $ | 275.62 | ||||||||||||
Peer Group | $ | 100.00 | $ | 106.92 | $ | 141.59 | $ | 158.97 | $ | 178.67 | $ | 241.77 | ||||||||||||
Source: MorningstarZack’s Investment Research
| * | We define Total Shareholder Return as: |
Since we place significant emphasis on long-term growth in our share price, we believe the information provided in the graph and table above to be important in understanding our compensation philosophy and its role in the achievement of our long-term objectives.
PART II: OBJECTIVES AND COMPONENTS OF OURMr. Hilton’s Compensation. The compensation paid to our chief executive officer, Mr. Hilton, is consistent with the executive compensation philosophy and program described in this CD&A that applies to all of our named executive officers. Mr. Hilton’s target total direct compensation is designed to be competitive with the target total direct compensation of other chief executive officers in the peer group and his annual and long-term incentive awards are aligned with Company performance on the earnings per share, return on capital and revenue growth measures reflected in the above tables.
34
At the beginning of 2013, the Compensation Committee, with input from its independent compensation consultant, established all the elements of Mr. Hilton’s 2013 target total direct compensation, including base salary, annual cash incentive and long-term incentive award opportunities and set the performance measures and related performance goals, i.e., earnings per share growth and return on capital for the annual plan and three-year cumulative revenue and cumulative earnings per share for the long-term plan. The Compensation Committee took into account a number of factors in establishing Mr. Hilton’s compensation for the annual and long-term incentives:
Mr. Hilton’s pay relative to the chief executive officer median compensation of the peer group;
the relative internal compensation relationships between Mr. Hilton and our other named executive officers, as compared to the pay relationships in the compensation data supplied by the consultant; and
the Board’s assessment of Mr. Hilton’s individual performance and overall Company performance for 2012.
As a result of this review, the Compensation Committee increased Mr. Hilton’s base salary for 2013 by 6.9%.
Shortly after 2013 ended, the Board reviewed Mr. Hilton’s performance for the year. The same process was employed as in the previous year. In assessing Mr. Hilton’s performance, the Board considered:
Mr. Hilton’s day-to-day performance and leadership of his executive team in making significant progress toward key strategic initiatives;
the Company’s financial performance in an uncertain and low-growth global macroeconomic environment;
the substantial value the management team delivered to shareholders with a share price increase of 22% for 2013;
Mr. Hilton’s exceptional, consistent leadership for the Company’s long-term success, specifically outstanding progress toward strengthening the Company’s overall long-term growth profile through acquisitions, including the Kreyenborg Group’s polymer processing businesses; and
Mr. Hilton’s strong emphasis on global development of the Company’s leadership and management capabilities.
With this input from the Board and the considerations above, the Compensation Committee, without Mr. Hilton present during its deliberations, determined that Mr. Hilton would receive an increase of 3.2% in his annual base salary for 2014.
With respect to payouts under the annual cash incentive plan and long-term incentive plan, the Committee first certified the performance results for 2013 against the pre-established performance measures. For the annual incentive plan, the Committee confirmed a payout at the formulary target amount of 100% of base salary, reflecting earnings per share growth at less than threshold performance and return on capital exceeding the maximum performance measure. The payout for the 2013 annual cash incentive plan was 29% lower than Mr. Hilton received for 2012 on a percentage-of-target basis. For the long-term incentive, the Committee confirmed that performance for the 2011-2013 measurement period exceeded the maximum performance measure for both three-year cumulative revenue and three-year cumulative earnings per share, resulting in a payout at the formulary maximum amount of 200% of target.
In summary and in the Compensation Committee’s judgment, Mr. Hilton’s total compensation reflects the Company’s performance under his leadership as well as his individual performance, and his total target compensation is within a reasonable range of the median of chief executive officer compensation for the peer group. The combination of performance share awards, restricted shares awards, stock option awards and annual cash incentive awards represents approximately 80% of Mr. Hilton’s target total direct compensation.
35
Executive Summary of Nordson’s Executive Compensation Program
EXECUTIVE COMPENSATION PROGRAM; ANALYSIS OF COMPENSATIONWe believe that we provide a straightforward, uncomplicated compensation structure for our named executive officers that is competitive without being excessive; is effective in attracting, retaining and motivating high caliber individuals; and aligns our executive officers’ interests with those of our long-term shareholders.
DECISIONS FOR FISCAL YEAR 2011
Objectives of our Executive Compensation Program
There are three primary objectives of Nordson’s executive compensation program. The following table describes each objective and how it is achieved:
Compensation Program Objective | How Objective is Achieved | |
| Create an ownership alignment with our long-term shareholders | • Long-term incentive awards are equity-based. • Share ownership requirements are in place for executive officers. • A substantial portion of executive officer |
35
|
| ||
| Foster engagement of the | • Incentive plan awards are based upon performance against long-standing and consistent pre-established financial measures as well as business segment • Earnings per share and return on capital measures and cumulative earnings per share and cumulative revenue measures are equally weighted in determining | ||
| Attract and retain | • Total direct compensation opportunities are targeted at or near the median of the peer group that we compete with for talent. • The three-year vesting period for equity awards (performance shares) enhances our retention incentives. | ||
“Pay-for-Performance” — Structure, Key Financial Measures and Impact on Compensation Payouts
Our executive compensation program is structured to ensure that a significant portion of the compensation paid to our executive officers is dependent upon the performance of our business. This “pay-for-performance” structure drives the effort to achieve our short-and long-term objectives. The program is also structured to ensure that it is not overly weighted toward annual cash incentive compensation and does not otherwise have the potential to threaten long-term shareholder value by promoting unnecessary or excessive risk-taking by our executive officers. The “Allocation of Executive Compensation” section in Part II of this CD&A describes our policies and practices for allocating compensation of our executive officers among the various categories and elements of compensation.
36
As described in the following table, we provide the variable elements of our executive compensation program — annual cash incentive compensation, long-term equity incentive compensation and equity-based compensation — to primarily encourage and reward performance that implements and advances our strategies and goals relating to financial performance and profitable growth, the very essence of our “pay-for-performance” philosophy.
Element of Variable Compensation | Encourage Executive Officers to: | Applicable Key Financial Measures /Impact on 2013 Compensation | ||
| Annual Cash Incentive Award | Achieve or exceed short-term objectives to drive shareholder return and increased value of our assets | • Diluted earnings per share and return on capital — we did not meet the threshold target level of performance on the former and exceeded the maximum performance on the latter. • Annual cash incentive payouts to the named executive officers were between 69% and 100% of target. | ||
| Long-Term Incentive Awards (performance share units) | Focus on our longer-term growth objectives | • Our cumulative revenue growth and cumulative earnings per share growth for the 2011-2013 performance period ended October 31, 2013 exceeded the maximum performance levels. • Long-term incentive awards for the three-year performance period ended October 31, 2013 paid out at 200% of target. | ||
| Other Equity-Based Incentives (stock options, restricted shares) | Maximize financial and operational performance that contributes to appreciation of our share price | • Our share price was $72.09 at fiscal year-end for 2013 as compared to $59.02 at fiscal year-end for 2012. | ||
37
EXECUTIVE COMPENSATION PROGRAM; ANALYSIS OF COMPENSATION
Processes and Procedures for Determining Executive Compensation
The Role of Shareholder Say-on-Pay Vote
At our 2013 Annual Meeting, approximately 97% of the shares voted were in favor of the “say-on-pay” proposal. The Committee believes that the shareholder vote confirms the philosophy and objective of linking our executive compensation to our operating objectives and the enhancement of shareholder value. We view this level of shareholder support as an affirmation of our current pay practices and, as a result, no significant changes were made to our executive compensation pay practices for 2014. The Committee will continue to consider the outcome of the say-on-pay vote when making future compensation decisions for the named executive officers.
Role of the Compensation Committee
The Compensation Committee is made up entirely of independent directors as defined by our Governance Guidelines and NASDAQ listing standards and has primary responsibility for designing our executive compensation program and for making compensation decisions under the program. In fulfilling its duties and responsibilities for 2011,2013, the Committee sought input, advice and recommendations from an executive compensation consultant as well as recommendations from our Chief Executive Officer on the compensation and performance of our executive officers.
Our executive compensation consultant provided usthe Committee with peer proxy and survey benchmark data with respect to all elements of an executive officer’s total direct compensation: base salary, annual cash incentive compensation, long-term incentive and equity-based compensation.compensation including how compensation paid to our executive officers compared to that of our proxy peer group. Included in the consultant’s review are longer-term analysisanalyses of our performance, including return on capital, earnings and revenue growth and total shareholder return, and how compensation paidrelative to our executive officers compares to thatthe performance of ourthe peer group.
We are not bound by the input, advice or recommendations we received from the executive compensation consultant or from our Chief Executive Officer. Instead, we at all times exercised independent judgment in making executive compensation decisions for 2011.2013.
We met six times in 2011. We met in executive session without management present to determine all elements of Mr. Hilton’s total compensation —– base salary, annual cash incentive compensation, long-term incentive compensation and equity-based compensation. We reviewed the summary of compensation of chief executive officers of the peer group companies and considered our executive compensation consultant’s recommendations in arriving at a base salary and equity-based grants for Mr. Hilton for 20112013 and determined annual cash incentive and long-term incentive payouts based on 20112013 performance. Mr. Hilton did not offer any recommendations for his compensation nor did he partake in our deliberations over his 2013 compensation.
36
Role of the Executive Compensation Consultant and Executive Management
Committee Resource: Committee Consultant
Role: Pursuant to its charter, the Committee is authorized to retain and terminate any consultant, assess the consultant’s independence from the Committee and the Company, as well as to approve the consultant’s fees and other terms of the engagement. The Committee also has the authority to obtain advice and assistance from internal or external legal, accounting or other advisors.
The Committee retained Exequity, Inc. (“Exequity”) as the executive compensation consultant reporting directly to the Committee. Exequity provides research, data analyses, survey information and design expertise in developing compensation programs for our executive officers. In addition, Exequity keeps the Committee apprised of regulatory developments and market trends related to
38
executive compensation practices. A representative of Exequity attends meetings of the Committee, is available to participate in executive sessions and communicates directly with the Committee. The lead consultant from Exequity reported directly to the Committee Chairperson and provided objective support based on expertise regarding current and emerging best practices with regard to executive compensation. Specifically, we asked Exequity to:
Provide information related to relevant trends in executive compensation practices;
Provide advice regarding the Company’s appropriate peer group;
Prepare a comprehensive report detailing the Company’s performance relative to its peer group with respect to total shareholder return and the metrics we employ to measure performance – earnings per share growth, revenue growth and return on capital;
Compare actual base, annual incentive and long-term incentive payments and equity awards for the executive officers to those in the peer group with comparable responsibilities, or with appropriate survey data where peer group proxy data was not available; and
Review this Compensation Discussion and Analysis.
During its November 25, 2013 meeting, the Committee considered the independence of Exequity in light of SEC rules and NASDAQ listing standards. Exequity provided the Committee with appropriate assurances and confirmation of its independent status and that of its lead consultant in the engagement pursuant to the Committee’s charter and the following factors: (1) other services provided to the Company by Exequity; (2) fees paid by us as a percentage of Exequity’s total revenue; (3) policies or procedures maintained by Exequity that are designed to prevent a conflict of interest; (4) any business or personal relationships between the senior advisor and a member of the Committee; (5) any company stock owned by the senior advisor; and (6) any business or personal relationships between our executive officers and the senior advisor. The Committee discussed these considerations and believes that Exequity and its lead consultant on the engagement have been independent in rendering services to the Committee and there is no conflict of interest between Exequity and the Committee.
Exequity also provided survey data and advice to our Governance & Nominating Committee regarding director compensation.
Committee Resource: Executive Management
Role: Our Chief Executive Officer and the Vice President, Human Resources provide additional information and analysis as requested by the Committee. More specifically, these executives had the following support roles to the Committee:
|
| |||||
|
| |||||
Executive Officer |
| VP, Human Resources |
| |||||||
• Developed written background and supporting materials for review prior to | Ö | Ö | ||||||||
• Attended the annual review presented by our compensation consultant of our executive officer compensation compared to that paid by our peer group companies | Ö | Ö | ||||||||
• Made recommendations about designs for and, if warranted, changes to our annual and long-term incentive programs | Ö | Ö | ||||||||
37
|
|
| ||||||||
• Provided a self-assessment of his performance for the fiscal year | Ö | |||||||||
• Provided an assessment of each executive officer’s performance | Ö | |||||||||
• Recommended annual base salary adjustments, payout levels under the annual cash incentive and long-term incentive plans and equity grants for executive officers other than | Ö | |||||||||
39
Benchmarking
We use general industry compensation surveys, proxy data and a peer group of companies from time to time as an input when making compensation decisions. Specifically, these surveys and sources of compensation data are used:
as an input in developing base salary ranges, annual incentive targets and long-term incentive award ranges;
to evaluate share utilization, overhang levels and annual run rate;
to benchmark the form and mix of equity awarded to executive officers;
to benchmark share ownership guidelines;
to assess the competitiveness of total direct compensation awarded to executive officers;
to validate whether our executive compensation program is aligned with Company performance; and
as an input in designing compensation plans, benefits and perquisites.
Our compensation peer group for Fiscal Year 20112013 consisted of 1520 publicly-traded companies listed below having revenues ranging from $462.5$749 million to $2.47 billion,$2,990 million, based on the most recent year endfiscal year-end public reports available at October 31, 2011.as of September 2012 when we reviewed data to set compensation for our executive officers for 2013. The median peer group revenues were $1,146.9$1,441 million. We are positioned below the median of the peer group in terms of revenue size and above the median in terms of market capitalization.
FY End | Company | Revenues ($MMs) | Market Cap ($MMs) | |||||||
| 08/10 | ACTUANT CORP | $ | 1,160.5 | $ | 1,351.0 | |||||
| 12/10 | ALBANY INTERNATIONAL CORP | $ | 914.4 | $ | 739.1 | |||||
| 12/10 | AMETEK INC | $ | 2,471.0 | $ | 6,310.6 | |||||
| 12/10 | BARNES GROUP INC | $ | 1,133.2 | $ | 1,123.2 | |||||
| 07/11 | DONALDSON CO INC | $ | 2,294.0 | $ | 4,127.0 | |||||
| 12/10 | DREW INDUSTRIES INC | $ | 572.8 | $ | 501.1 | |||||
| 10/10 | ESTERLINE TECHNOLOGIES CORP | $ | 1,526.6 | $ | 1,833.8 | |||||
| 04/11 | GERBER SCIENTIFIC INC | $ | 462.5 | $ | 239.9 | |||||
| 12/10 | GRACO INC | $ | 744.1 | $ | 2,371.2 | |||||
| 12/10 | IDEX CORP | $ | 1,513.1 | $ | 3,225.1 | |||||
| 09/10 | KULICKE & SOFFA INDUSTRIES INC | $ | 762.8 | $ | 439.4 | |||||
| 10/10 | NORDSON CORP | $ | 1,041.6 | $ | 2,651.1 | |||||
| 12/10 | NOVELLUS SYSTEMS INC | $ | 1,349.2 | $ | 2,914.6 | |||||
| 08/10 | ROBBINS & MYERS, INC. | $ | 584.7 | $ | 779.9 | |||||
| 12/10 | ROPER INDUSTRIES INC | $ | 2,386.1 | $ | 7,286.6 | |||||
| 12/10 | WATTS WATER TECHNOLOGIES INC | $ | 1,274.6 | $ | 1,356.3 | |||||
|
|
|
|
|
| |||||
| MEDIAN | $ | 1,146.9 | $ | 1,595.0 | ||||||
Company | Revenues ($MMs) | Market Cap Dec. 2011 ($MMs) | ||||||
Actuant Corporation | $ | 1,445 | $ | 1,555 | ||||
Albany International Corp. | $ | 815 | $ | 647 | ||||
AMETEK Inc. | $ | 2,990 | $ | 6,740 | ||||
Barnes Group Inc. | $ | 1,169 | $ | 1,320 | ||||
Chart Industries Inc. | $ | 795 | $ | 1,593 | ||||
CLARCOR Inc. | $ | 1,126 | $ | 2,511 | ||||
Donaldson Company, Inc. | $ | 2,303 | $ | 5,045 | ||||
Entegris, Inc. | $ | 749 | $ | 1,179 | ||||
Esterline Technologies Corp. | $ | 1,718 | $ | 1,714 | ||||
FLIR Systems, Inc. | $ | 1,544 | $ | 3,911 | ||||
Gardner Denver, Inc. | $ | 2,371 | $ | 3,898 | ||||
Graco Inc. | $ | 895 | $ | 2,441 | ||||
Graftech International Ltd. | $ | 1,320 | $ | 1,985 | ||||
IDEX Corporation | $ | 1,838 | $ | 3,096 | ||||
Lincoln Electric Holdings, Inc. | $ | 2,695 | $ | 3,278 | ||||
Robbins & Myers, Inc. | $ | 821 | $ | 2,223 | ||||
Roper Industries, Inc. | $ | 2,797 | $ | 8,381 | ||||
Veeco Instruments Inc. | $ | 979 | $ | 805 | ||||
Watts Water Technologies Inc. | $ | 1,437 | $ | 1,005 | ||||
Woodward, Inc. | $ | 1,712 | $ | 2,822 | ||||
|
|
|
|
| ||||
MEDIAN | $ | 1,441 | $ | 2,332 | ||||
Nordson Corporation | $ | 1,233 | $ | 2,691 | ||||
|
|
|
|
| ||||
The Compensation Committee believes the listed peer companies serve as the appropriate peer group because they have a significant portion of theirglobal scope and business located or transacted internationally, havecomplexity, a business focus on precision industrial manufacturing, and have profiles or business models similar to Nordson’s based on business complexity, industries or diverse markets served, innovation and
40
technology, and global strategy.growth strategies. The Compensation Committee regularly reviews the peer group and makes any modifications necessary to ensure the group most closely resembles our competitive market for executive talent. In determining any changes, the Compensation Committee considers numerous financial measures and Nordson’s position relative to the proposed peer companies. No changes were made from 2010 to the peer group for 2011.
Allocation of Executive Compensation
Our executive compensation program does not prescribe a specific formula for the mix of base salary and annual and long-term incentive components so that we have flexibility in developing an appropriate compensation mix. Generally, we would likeset base salaries for our named executive officers to be near or at the median for our peer group companies, as a base line for base salary compensation for our named executive officers, taking
38
into account the experience level of the individuals in their current positions. The majority of the other compensation components are dependent upon how well we perform and the performance of ourNordson common shares. Within the total direct compensation opportunity for any named executive officer, individual components of compensation may be greater or lesser than the median because the CommitteeCommittee’s focus is primarily concerned withon the competitiveness of the entire programcompensation package versus any one element of compensation.
Actual compensation realized can vary significantly from the target opportunity for any component of compensation or for total direct compensation based on company or individualfinancial and business segment operating performance and company share price fluctuation. Consistent with market practice, Mr. Hilton’s compensation is substantially more than that of other executive officers based on his level of responsibility. As part of the process for determining total direct compensation, we also review total target direct compensation tally sheets which detail the value and accumulated potential payout of each element of an executive officer’s total target direct compensation. The tally sheets allow us to assess the retention value of an executive officer’s total direct compensation and review the internal equity of our executive officer compensation program.
The table below reflects the approximate allocation mix at target among the three elements of total direct compensation – base salary, annual cash incentive opportunity, and long-term incentive opportunity – for our named executive officers at the time we set compensation for 2011, based on total target direct compensation:2013:
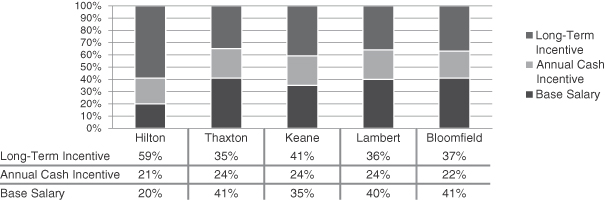

41
For the long-term incentive element of 2013 compensation, the approximate allocation among the various elements of long-term (equity) compensation – stock options, restricted shares and performance share units – is illustrated below:
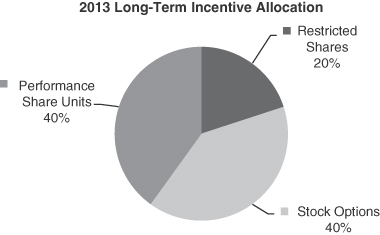
Summary Table — Components of Our Executive Compensation Program
CompensationThe table below summarizes the elements and objectives of our 2013 compensation program for executive officers, including our named executive officers for 2011 consists principallyofficers.
For those awards based on the Company’s performance, our specific decisions around setting performance goals and other actions impacting executive compensation focus on certain areas that are tied directly to our business plan and that we believe are the most critical value drivers of the components identified inbusiness, such as revenue, earnings and return on capital. Actual performance goals vary from year to year based on the following summary table:business environment and the Committee’s determination of goals that it believes are important for a particular year.
Pay Component | Linkage to Compensation Objectives | Form of Compensation | ||
Base Salary | salaries to attract and retain | Fixed cash element of total direct compensation. Actual base salary may be above or below the market median to recognize management responsibilities, individual abilities and performance, level of experience and tenure with our | ||
Annual Cash Incentive | Provide incentive to achieve and exceed critical business objectives with actual awards based on attainment of pre-established corporate and operational objectives | Cash payments tied to growth in earnings per share and return on capital | ||
Long-term Equity-based Incentive | Provide strong incentive to meet or exceed pre-established long-term financial goals that align with long-term shareholder interests; value tied to Nordson common share price; attract, retain and motivate executive talent | -Stock options (~40% of long-term award value); -Performance share units (~40% of long-term award value) paid in shares; and -Restricted shares (~20% of long- term award value) | ||
3942
Pay Component | Linkage to Compensation Objectives | |||
| Form of | |||
|
| |||
Welfare and Retirement Benefits | ||||
| Health, life and disability insurance, pension and 401(k) plans | Provide competitive employer benefits structure; attract and retain executive | Broad-based employee welfare and retirement | ||
Excess Pension Plan | Restore benefits that are limited by the Internal Revenue | Cash paid in a lump sum or | ||
Deferred Compensation Plan | Reinforce our compensation philosophy of encouraging and facilitating share ownership and aligning the long-term interests of executives with shareholders; provide tax-deferred vehicle for retirement income | Cash or equivalent share units which convert to common shares on a one-for-one basis at | ||
| Attract and retain executive talent through competitive benefits and | Annual physical exam, tax/financial planning or preparation services, airline club | ||
Change-in-Control Benefits | Align executive and shareholder interests by enabling our executive officers to consider corporate transactions that are in the best interests of our shareholders and other constituents without undue concern over whether the transactions may jeopardize the officer’s own |
| ||
40
Components of Executive Compensation —– Base Salary, Annual and Long-Term Incentives, Perquisites, Welfare and Retirement Benefits, Severance and Change-in-Control Benefits —– and 20112013 Compensation Actions / Analysis
Base Salary
The Committee determines annually the base salaries of our executive officers, including whether to grant annual meritbase salary increases, based on the following factors:
Level of experience and responsibility;
Company, business unitsegment and individual performance during the prior year;
Market and survey data;
Internal pay equity;
The Committee’s assessment of other elements of compensation provided to the executive officer; and
The Chief Executive Officer’s recommendation, for all named executive officers other than himself.
43
20112013 Actions and Analysis
Considering Mercer’s recommendationExequity’s benchmark studies and thatanalyses and the recommendations of our Chief Executive Officer, we set individual base salaries of our named executive officers for 20112013 at a level consistent with the objective of paying total direct compensation at or near the median for median performance.of our peer group. Actual base salary levels were determined by considering the factors listed above resulting in base salaries that, in some cases, are more or less than the median of the peer group.
The following table reflects the annualized base salaries of our named executive officers for 2011:2013 and 2012:
Name | Base Salary 2011 ($) | Base Salary 2010 ($) | Increase From 2010 Base Salary (%) | Base Salary 2013 ($) | Base Salary 2012 ($) | |||||||||||||||
Michael F. Hilton | 700,000 | 675,000 | 3.7 | 775,000 | 725,000 | |||||||||||||||
Gregory A. Thaxton | 330,000 | 308,000 | 7.1 | 375,000 | 345,000 | |||||||||||||||
John J. Keane | 330,000 | 318,000 | 3.8 | 367,000 | 345,000 | |||||||||||||||
Peter G. Lambert | 285,000 | 268,000 | 6.3 | 320,000 | 300,000 | |||||||||||||||
Douglas C. Bloomfield | 250,000 | 238,000 | 5.0 | |||||||||||||||||
Gregory P. Merk1 | 300,000 | 260,000 | ||||||||||||||||||
| (1) | Mr. Merk was promoted to Senior Vice President effective May 1, 2013. His actual base salary earned during 2013 was $289,000. |
Annual Cash Incentive Compensation
The Management Incentive Compensation Plan (the “Annual Cash Incentive Plan”), which was approved by our shareholders, is an annualAnnual cash incentive plancompensation is intended to comply with the performance-based compensation requirements of Section 162(m) of the Internal Revenue Code of 1986, as amended. Performance and payouts underPayouts are determined based upon the Annual Cash Incentive Plan are assessed based on two factors: (i) a quantitative performance factor consistinglevel of achievement against pre-established corporate financial measures —– diluted earnings per share growth and return on capital —– and, for our named executive officers that run our business segments, achievement against pre-established business segment operating performance measures. Corporate financial measures such as revenueare weighted 100% for our Chief Executive Officer and operating profit growth and operating margin and asset management, and (ii) a qualitative individual performance factor.Chief Financial Officer. For the named executive officers that run our business segments, the quantitative performance factors are weighted equally. We evaluate the appropriateness of the structural nature of corporate financial measures over an entire ten-year business cycle and for 2011, concluded that the corporate financial measures continue to be relevant benchmarks for assessing performance under the quantitative performance factor element for purposes of incentive payouts. We certify that performance thresholds and any other material terms of the Annual Cash Incentive Plan were met or exceeded based on fiscal year end results prior to any payouts being made.
41
Under the Annual Cash Incentive Plan, each executive officer is eligible to receive for any fiscal year a maximum annual incentive payout equal to 1.5% of our operating cash flow for that fiscal year, but in no event shall such incentive award exceed $2,000,000. “Operating cash flow” is defined in the Plan as: “operating income plus depreciation, amortization and other non-cash charges such as write-downs to the acquired or carrying value of assets and charges for the impairment of goodwill and other intangible assets during such period, as reported in our financial statements, adjusted to eliminate the effects of expenses for restructuring or productivity initiatives and any expenses or write-offs in connection with acquisitions or divestitures.” The Compensation Committee retains the discretion to decrease payouts below this maximum amount but may not increase payouts above this maximum amount.
The formula depicted below reflects methodology we employ in determining actual Annual Cash Incentive Plan payouts for the named executive officers:
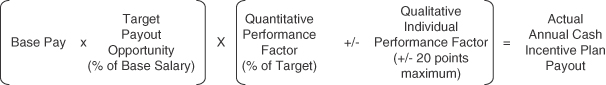
Quantitative Performance Factor
The quantitative performance factor is composed of two elements: corporate financial measures and business segment measures:performance results are weighted equally.
Corporate Financial Measures. For the corporate financial measures element, we
We consider diluted earnings per share growth and return on capital to be measures critical to our success. We believe these measures offer the proper balance between growth and profitability and align the interests of our executive officers with those of our long-term shareholders because we believe achieving greater return on capital and earnings per share growth over time will drive improved shareholder return and foster maximum value for our assets. More specifically:
Diluted earnings per share growth measures the rate at which management has succeeded in increasing the profits per unit of ownership by shareholders. Earnings per share growth is easily compared among peers and the measure is commonly used by the investment community to evaluate performance. The formula we utilize for diluted earnings per share is net income divided by weighted average common diluted shares outstanding.
Return on capital measures the amount of profitability per unit of capital invested by management to generate earnings. For purposesWe have adopted a definition of setting compensation for 2011 and determining payouts, we define return on capital as: (netthat is consistent with financial disclosure in our Form 10-K Report: Net income (loss), plus after-tax net interest expense — 10% post-2009 good will) ÷ (equityon debt as a percentage of the average of quarterly debt (net of cash) plus total debt and leases minus cash and marketable securities minus post-2009 goodwill).average quarterly shareholders’ equity over five accounting periods.
Business Segment Measures. Operating Performance
For named executive officers that lead our business segments, segment business and operational measures are established at the beginning of the fiscal year through a collaborative effort with our Chief Executive Officer. The measures vary by individual officers and include business segment financial performance, operating profit and margin growth, capital expenditure control, and asset management.
Qualitative Individual Performance Factor
Individual qualitative measures44
We verify if performance thresholds and any other material terms of the annual cash incentive awards were met or exceeded based on fiscal year-end results prior to any payouts being made.
We may use our discretion to adjust slightly the payout for each executive officer are established with inputby considering a qualitative assessment of the executive officers received from our Chief Executive Officer. Among the qualitative measures assessed are portfolio expansion, emerging market growth, market share increase and penetration, support for mergers and acquisition opportunities and continuous improvement, support for new products and technology advancements, improving core processes, succession planning and talent development and community involvement.
42
Under the annual cash incentive plan in place for 2013, each executive officer is eligible to receive a maximum annual cash incentive payout equal to 1.5% of our operating cash flow for that fiscal year, but in no event shall such incentive award exceed $2,000,000. “Operating cash flow” is defined as: “operating income plus depreciation, amortization and other non-cash charges such as write-downs to the acquired or carrying value of assets and charges for the impairment of goodwill and other intangible assets during such period, as reported in our financial statements, adjusted to eliminate the effects of expenses for restructuring or productivity initiatives and any expenses or write-offs in connection with acquisitions or divestitures.” The Committee doesretains the discretion to decrease payouts below this maximum amount but may not assign a particular weight to any individual measure discussedincrease payouts above in determining the qualitative individual performance factor for our executive officers. Rather, the Committee’s determination of the individual performance factor is subjective and taken with regard to the totality of the executive’s achievements.
Based on this qualitative assessment of a named executive officer’s individual performance, the Committee may use the qualitative individual performance factor to adjust the quantitative performance factor by plus or minus 20 points. In all cases, the Annual Cash Incentive Plan payout cannot exceed the maximum payout permitted under the Plan.amount.
20112013 Actions and Analysis
In setting Annual Cash Incentive Planthe annual cash incentive payout opportunities for 2011,2013, we considered Mercer’sExequity’s analysis of the general industry survey and the compensation peer groupgroup’s annual cash incentive payout levels and set a target payout opportunity for our executive officers as well as the threshold and maximum payout opportunity for the quantitative performance factor as a percentage of annualized base salaries. The following table reflects the payout opportunities as a percentage of base salary:
| Hilton | Thaxton | Keane | Lambert | Bloomfield | Hilton | Thaxton | Keane | Lambert | Merk | |||||||||||||||||||||||||||||||
Threshold | 50 | % | 30 | % | 35 | % | 30 | % | 27.5 | % | 50 | % | 32.5 | % | 35 | % | 30 | % | 27.5 | % | ||||||||||||||||||||
Target | 100 | % | 60 | % | 70 | % | 60 | % | 55 | % | 100 | % | 65 | % | 70 | % | 60 | % | 55 | % | ||||||||||||||||||||
Maximum | 200 | % | 120 | % | 140 | % | 120 | % | 110 | % | 200 | % | 130 | % | 140 | % | 120 | % | 110 | % | ||||||||||||||||||||
We established also the following corporate financial measures at threshold, target and maximum as indicated in the table below during our December 2010November 2012 meeting and confirmed actual performance of the measures at 200% of target during our November 28, 2011 meeting, resulting in a 200% quantitative performance factor for each named executive officer based on corporate financial measures:2013 meeting:
Measure | Threshold | Target | Maximum | Actual | Threshold | Target | Maximum | Actual | ||||||||||||||||||
Return on Capital | 8.0% | 11.5% | 16.0% | 36.5% | 8.0% | 11.5% | 16.0% | 17.6% | ||||||||||||||||||
Diluted Earnings Per Share Growth | 0% | 10% | 20% | 32% | 0% | 10% | 20% | -0.9% | ||||||||||||||||||
— Equivalent Amount per Share | $2.30 | $2.53 | $2.76 | $3.25 | $3.45 | $3.80 | $4.14 | $3.42 | ||||||||||||||||||
For the business
45
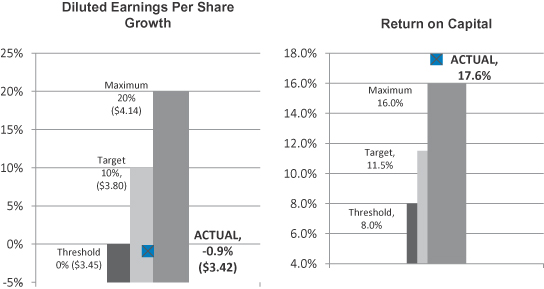
Business segment measures, we considered Mr. Hilton’s assessment that Messrs. Keane, Lambert and Bloomfield exceeded the revenue growth, operating profit and operating margin targetsresults varied. The calculated payout for their respective segments but fell short of expectations for asset management, and confirmed actual performance of the business measures (as a percent of target): 190% for Mr. Keane, 175% for Mr. Lambert and 175% for Mr. Bloomfield.
The result of the process lead to a total quantitative performance factor for theour named executive officers, (other than Mr. Hilton) of: Thaxton — 200%, Keane — 195%, Lambert — 188% and Bloomfield — 188%.
Based on Mr. Hilton’s assessment, we determinedbased upon the qualitative individual performance factor for each named executive officer but Messrs. Hilton and Mr. Thaxton: Mr. Keane, + 10 points; Mr. Lambert, +2 points; and Mr. Bloomfield, + 7 points. We did not determine a qualitative individual performance factor for Mr. Thaxton, adopting instead Mr. Hilton’s recommendation that Mr. Thaxton’s Annual Cash Incentive Plan payout be determined solely by the quantitative performance factor.
Mr. Hilton’s Compensation
Following the same process described above, in determining Mr. Hilton’s Annual Cash Incentive Plan payout, we first considered the Company’s 2011 record financial performance under his leadership compared to a very strong 2010. In addition to corporate financial measuresand business segment operating results, ranged from 69% - 100% of performance, the Board of Directors evaluated Mr. Hilton’s day-to-day performance in his first full year as our Chief Executive
43
Officer and concluded that Mr. Hilton provided exceptional, consistent leadership of his executive team. His performance contributed to our decision to pay a cash incentive payment to Mr. Hilton at the 200% quantitative performance factor without any qualitative performance factor adjustment.target.
Summary of Payouts
The following table summarizes the quantitative performance factors — corporate financial and business segment performance measures, individually and combined; qualitative individual performance factor adjustment; annual cash incentive plan payout (in dollars and as a percentage of target) to the named executive officers (all percentages reflect percent of target):
Named Executive Officer | Business Segment Measure | Corporate Financial Measure | Quantitative Performance Factor | Qualitative Individual Performance Factor Adjustment | Annual Cash Incentive Plan Payout ($) | Payout | Combined Performance Factor | Annual Cash Incentive Plan Payout ($) | ||||||||||||||||||||||||
Michael F. Hilton | — | 200 | % | 200 | % | — | 1,400,000 | 200 | % | 100 | % | 775,000 | ||||||||||||||||||||
Gregory A. Thaxton | — | 200 | % | 200 | % | — | 396,000 | 200 | % | 100 | % | 243,750 | ||||||||||||||||||||
John J. Keane | 190 | % | 200 | % | 195 | % | +10 pts | 473,550 | 205 | % | 69 | % | 177,261 | |||||||||||||||||||
Peter G. Lambert | 175 | % | 200 | % | 188 | % | +2 pts | 324,900 | 190 | % | 72 | % | 137,760 | |||||||||||||||||||
Douglas C. Bloomfield | 175 | % | 200 | % | 188 | % | +7 pts | 268,125 | 195 | % | ||||||||||||||||||||||
Gregory P. Merk | 81 | % | 128,750 | |||||||||||||||||||||||||||||
For 2011, the Company’s operating cash flow as defined in the Plan was $357,633,000, resulting in a maximum payout opportunity to each named executive officer under the Annual Cash Incentive Plan of $5,364,500 prior to application of the payout cap — $2,000,000. All payouts were below the maximum annual cash incentive payout amount permitted under the Annual Cash Incentive Plan.annual incentive plan.
Long-Term Incentive Compensation
Under our Long-Term Performance Plan we can grant a varietyWe provide long-term incentive compensation in the form of share-based awards, including performance share units,shares, stock options, and restricted shares. Our Chief Executive Officer makes annual recommendationsshares to our named executive officers because we believe these forms of compensation align company performance and executive officer compensation with the Compensation Committee of the type and amount of equity awards for the executive officers. Because all components of the long-term incentive opportunity are delivered in Nordson common shares, they all become more or less valuable with changes in the priceinterests of our common shares. The Committee has selected three award types for the executive officer’s long-term incentives: stock options and restricted stock to retain talent and directly align executives’ interests with those of our shareholders and performance share units which are earned upon the attainment of performance goals over a three-year period to provide focus on our longer-term goals — cumulative revenue growth and cumulative earnings per share growth.shareholders.
We establish an intended long-term incentive value for each executive officer with reference to the total direct compensation opportunity for the executive officers. The actual value realized ofCommittee’s goal is to target total direct compensation may differ significantly (up or down) fromapproximating the intended value due to our share price performance over the lifemedian of the awards, andcompensation peer group. Actual target award levels for individual named executive officers may vary above or below the extent to which performance targets are met.median based on a variety of factors.
We set the total long-term incentive opportunity and then allocate approximately 40% of the total target value of each executive officer’s long-term incentive compensation to stock options; approximately 40% to the performance share opportunity and approximately 20% to restricted stock.shares. This allocation
46
balances the opportunity between performance shares, which are earned based on achievement of long-term financial operational and strategic measures and stock options and restricted stock,shares, the value of which is based on long-term performance of our common shares.
We fix the exercise price of an option (the price at which the shares may be purchased) at the fair market value on the grant date. Thus, an option becomes more valuable as the price of our common shares increases. Alternatively, an executive officer will not receive any value from a stock option if the price of our common shares decreases below the exercise price of the option. Stock options are also a
44
valuable retention tool because our option grants vest over a period of time and, with a few limited exceptions, unvested options are forfeited if an executive officer’s employment terminates.Performance Share Units
Performance share units awarded under the Long-Term Incentive Plan, which is an element of our Long-Term Performance Plan, entitle the recipient to receive one share of Nordson common stock for each performance share unit upon the satisfaction of pre-established performance objectives and other conditions to earningmeasures over a three-year period. Once earned, the award. The awardsunits are paid out atsettled with unrestricted shares. Payouts (if any) are not made until the endexpiration of the three-year performance period based onand the performance if thresholdresults are verified by the Compensation Committee.
We believe that performance levelsshares align the interests of our named executive officers with the interests of our shareholders because the number of shares earned and the shares’ potential value are achieved.tied to the achievement of sustained profitability. In selecting the performance goals for the performance shares, the Committee considers whether the goals are appropriately aligned with those in the annual cash incentive plan so that the overall compensation design does not unintentionally encourage participants to take unnecessary or excessive risk or actions that are inconsistent with the Company’s short- and long-term strategic and financial objectives.
Under our Long-Term Incentive Plan, with respect to performance shares,long-term incentive plan in place for 2013, each executive officer is eligible to receive for any fiscal year a maximum aggregate payout value in common shares equal to 1.0% of our operating cash flow during a performance period, but in no event shall such payout have a value greater than $4,000,000. The definition of “operating cash flow” for purposes of determining the payout maximum under the Long-Term Incentive Planlong-term incentive plan is the same as the definition used for determining the permitted maximum payout under the Annual Cash Incentive Plan.annual cash incentive plan. The Compensation Committee retains the discretion to decrease payouts below this amount but may not increase payouts above this maximum amount.
Our restricted stock program is designed to align executive officers’ interest with that of our long-term shareholders. The Committee also views this program as an important management succession planning, retention and recognition tool. Restricted stock provides participants with dividends and voting rights beginning on the award date. Shares of restricted stock generally will vest over a three-year period.
2011 Actions and Analysis
Stock Options
We granted stock options for 2011 to our executive officers at our December 7, 2010 meeting, at the same time we granted options to other key employees under our Key Employee Stock Option Program. We have historically granted stock options during this meeting, which is scheduled annually at this time of year to permit us to certify prior fiscal year performance results, determine incentive plan payouts and set compensation and performance goals for the next fiscal year.
The options granted to our named executive officers in 2011 expire in ten years; have an exercise price equal to the closing price of our common shares on the grant date (December 7, 2010) and vest in 25% increments in each of the four years following the grant date.
The following table provides the number of stock options granted to our named executive officers for 2011:
Named Executive Officer | Options (# Shares) | Grant Date Fair Value ($) (1) | ||||||
Michael F. Hilton | 50,000 | 859,250 | ||||||
Gregory A. Thaxton | 11,400 | 195,909 | ||||||
John J. Keane | 16,000 | 274,960 | ||||||
Peter G. Lambert | 10,600 | 182,161 | ||||||
Douglas C. Bloomfield | 9,400 | 161,539 | ||||||
45
Performance Share Units
2011-2013 Performance Period. At the beginning of the fiscal year, we set performance goals for the 2011-2013 long-term incentive opportunity. Payouts of performance share units are conditioned upon the Company’s achieving at least threshold performance for cumulative diluted earnings per share and cumulative revenue over the three-year performance period. The performance share unit opportunity granted for each of the named executive officers at the threshold, target and maximum performance levels are as follows:
| Potential Payout (# Units) | ||||||||||||
Name | Threshold | Target | Maximum | |||||||||
Michael F. Hilton | 9,000 | 18,000 | 36,000 | |||||||||
Gregory A. Thaxton | 2,000 | 4,000 | 8,000 | |||||||||
John J. Keane | 2,800 | 5,600 | 11,200 | |||||||||
Peter G. Lambert | 1,900 | 3,800 | 7,600 | |||||||||
Douglas C. Bloomfield | 1,600 | 3,200 | 6,400 | |||||||||
The 2011-2013 performance period threshold, target, and maximum cumulativeCumulative diluted earnings per share growth and cumulative revenue growth are employed as performance measures are:
Measure | Threshold | Target | Maximum | |||
Cumulative Diluted Earnings Per Share Growth | 4% | 8% | 14% | |||
— Equivalent amount per share | $7.47 | $8.06 | $9.02 | |||
Cumulative Revenue Growth | 5% | 7% | 11% | |||
— Equivalent revenue levels | $3,448,000 | $3,583,000 | $3,864,000 |
These measures were chosenfor the long-term incentive award because they offer a balance between growth, as measured by revenue, and profitable growth. As a result, we weighted each performance measure evenly in terms of determining payout opportunity. More specifically,
Cumulative diluted earnings per share growth measures the rate at which management has succeeded in growing profits on a sustained basis over a three-year period. It is the constant percentage by which diluted earnings per share would need to grow over a base period amount during a three-year period such that the sum of diluted earnings per share calculated at such a constant growth rate for such three years is equal to the sum of the actual diluted earnings per share earned over the same three-year period. It is a superior measure of sustained earnings growth because it is influenced by the earnings performance during each year of the performance period rather than simply a compound growth rate that compares the final year’s earnings to the base period amount.
Cumulative revenue growth is a similar measure to cumulative diluted earnings per share growth except that it measures the rate at which management has succeeded in growing revenue on a sustained basis over a three-year period. While the growth in profits and profitability are of primary importance, management is also expected to grow the size and scale of the Company and cumulative revenue growth is an effective measure of their success in doing so.
We believe these two measures together align the interests of our executive officers with those of our long-term shareholders because achieving sustained earnings per share growth and revenue growth over time will drive improved shareholder return and foster maximum value for our assets.
4647
2009-20112011-2013 Performance Period.Period In December 2008, we established the following threshold, target, and maximum cumulative earnings per share growth and cumulative revenue growth performance measures for the 2009-2011 performance period:
Measure | Threshold | Target | Maximum | |||
Cumulative Diluted Earnings Per Share Growth | 4% | 8% | 14% | |||
— Equivalent amount per share | $5.55 | $6.00 | $6.71 | |||
Cumulative Revenue Growth | 5% | 7.5% | 14% | |||
— Equivalent revenue levels | $3,723,000 | $3,906,000 | $4,411,000 |
For the 2009-20112011-2013 performance period, the Company’s operating cash flow over the performance period was $823,817,000, yielding a maximum award opportunity of $8,238,170 for each participant, subject to the $4,000,000 maximum payout amount permitted under the Long-Term Incentive Plan.
Cumulativecumulative diluted earnings per share for the three-year period were $6.71,$10.12 which is equivalent to a constant annual growth rate of 14%20.4% over the three-year performance period. Cumulative revenue for the three-year period was $3,094,000. In addition and consistent with our authority$4,185,658,000 which is equivalent to exclude certain one-time charges or benefits in determining performance results and payouts, in determining payouts for the 2009-2011 Long-Term Incentive Plan we excluded the negative and distorting effecta constant annual growth rate of the $3.54 per share charge recognized in 2009 for impairment of goodwill and other long-lived assets and also the tax benefit in the amount of $.16 per share associated with the write-off of our tax basis in UV graphics arts product lines which were sold in 2010.15.3%.
We confirmed performance for the cumulative diluted earnings per share growth measure was atexceeded the maximum level; and performance for the cumulative revenue growth measure was below threshold,also exceeded the maximum level, yielding a payout at 200% of the aggregate target opportunity for the 2009-20112011-2013 performance period.
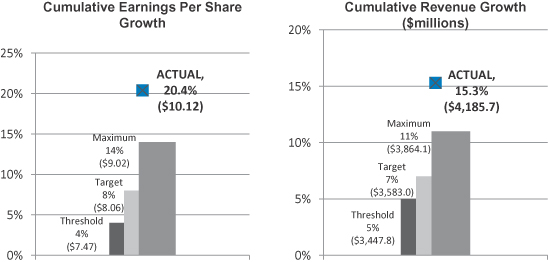
The following table sets forth informationsummarizes the two in-progress tranches of the long-term incentive award program:
| Performance Period | Performance Measure | Threshold, Target and Maximum Performance Levels | Status | |||
2012-2014 | Cumulative Diluted Earnings per Share Growth | Threshold = 4% ($10.55) Target = 8% ($11.39) Maximum = 14% ($12.74) | Results will be certified at the end of the performance period. | |||
| Cumulative Revenue Growth | Threshold = 5% ($4,082,000,000) Target = 7% ($4,242,100,000) Maximum = 11% ($4,574,800,000) | |||||
2013-2015 | Cumulative Diluted Earnings per Share Growth | Threshold = 4% ($11.20) Target = 8% ($12.10) Maximum = 14% ($13.53) | Results will be certified at the end of the performance period. | |||
| Cumulative Revenue Growth | Threshold = 5% ($4,666,000,000) Target = 7% ($4,848,900,000) Maximum = 11% ($5,229,200,000) | |||||
48
Stock Options
Stock options align the interests of the named executive officers with those of shareholders because the stock options only have value if the price of the Company’s stock increases after the stock options are granted. Stock options vest in 25% increments over a four-year period (beginning one year from the date of grant) and expire ten years from the date of grant. We fix the exercise price of an option at the fair market value on the grant date. Thus, an option becomes more valuable as the price of our common shares increases. Alternatively, an executive officer will not receive any value from a stock option if the price of our common shares decreases below the exercise price of the option. Stock options are also a valuable retention tool because our option grants vest over a four-year period and unvested options are forfeited if an executive officer voluntarily terminates his or her employment.
2013 Actions
We granted stock options to our executive officers during our meeting on November 28, 2012, at the same time we granted options to other key employees under our Key Employee Stock Option Program. We have historically granted stock options during this meeting, which is scheduled annually at this time of year to permit us to verify prior fiscal year performance results, determine incentive plan payouts and set compensation and performance goals for the 2009-2011 long-term incentive opportunity for eachnext fiscal year.
The following table provides the number of stock options granted to our named executive officers: potential payout (in number of share units) at threshold, target and maximum performance levels; and actual payouts (rounded to the nearest whole share) and dollar value of the payout based on our share price on date the payout was made — $41.85 per share.officers for 2013:
| Potential Payout (# Units) | Actual Payout (# Shares) | Actual Payout Value ($) | ||||||||||||||||||||||||||
Named Executive Officer | Threshold | Target | Maximum | Options (# Shares) | Grant Date Fair Value ($) (1) | |||||||||||||||||||||||
Michael F. Hilton | — | — | — | — | — | 43,000 | 1,051,974 | |||||||||||||||||||||
Gregory A. Thaxton | 4,700 | 9,400 | 18,800 | 9,400 | 393,390 | 11,000 | 269,110 | |||||||||||||||||||||
John J. Keane | 8,000 | 16,000 | 32,000 | 16,000 | 669,600 | 11,900 | 291,128 | |||||||||||||||||||||
Peter G. Lambert | 4,000 | 8,000 | 16,000 | 8,000 | 334,800 | 8,500 | 207,948 | |||||||||||||||||||||
Douglas C. Bloomfield | 4,000 | 8,000 | 16,000 | 8,000 | 334,800 | |||||||||||||||||||||||
Gregory P. Merk | 7,600 | 185,930 | ||||||||||||||||||||||||||
All payouts were below the maximum payout amount permitted under the Long-Term Incentive Plan.
| (1) | The grant date fair value was determined using the Black-Scholes option pricing model. The actual value of stock option awards will be determined by the value of our common shares on the date of exercise. |
Restricted Shares
Our restricted share program is designed to align executive officers’ interest with that of our long-term shareholders. The Committee also views this program as an important management succession planning, retention and recognition tool. Restricted shares cannot be transferred until they vest. Shares generally will vest over a three-year period. Restricted shares provide participants with dividends and voting rights beginning on the award date.
2013 Actions
We granted restricted stockshares to executive officers on December 7, 2010during our November 28, 2012 meeting with one-third of the grant vesting annually each year for three years. The share price on the grant date was the closing price on December 7, 2010 — $43.32.November 28, 2012 – $61.59. The following table provides information regarding the restricted share grant:
Named Executive Officer | Restricted Shares Granted (#) | Grant Date Value ($) | Restricted Shares Granted (#) | Grant Date Value ($) | ||||||||||||
Michael F. Hilton | 9,000 | 389,880 | 8,000 | 492,720 | ||||||||||||
Gregory A. Thaxton | 2,000 | 86,640 | 2,000 | 123,180 | ||||||||||||
John J. Keane | 2,800 | 121,296 | 2,200 | 135,498 | ||||||||||||
Peter G. Lambert | 1,800 | 77,976 | 1,550 | 95,465 | ||||||||||||
Douglas C. Bloomfield | 1,600 | 69,312 | ||||||||||||||
Gregory P. Merk | 1,450 | 89,306 | ||||||||||||||
4749
Executive Perquisites
We provide limited and modest perquisites to each of our executive officers to promote the business objectives facilitated by each perquisite described below. We also use these perquisites to help ensure that our executive compensation program remains competitive to allow us to attract and retain top executive talent.
Business Clubs. We reimburse Mr. Hilton for two private business club memberships to encourage entertainment of business colleagues and customers, engaging in social interaction with peers from other companies, local leadership in the community and holding business meetings at a convenient offsite location. In addition, we provide all executive officers with memberships to airline travel clubs that allow them to be more productive when traveling on commercial airlines. We do not reimburse any executive officer for personal expensesfees or dues associated with apersonal country club memberships.
Financial, Estate, and Tax Planning and Preparation. We pay or reimburse our executive officers for financial, estate and tax planning and preparation fees and expenses. The maximum reimbursementamount is $5,000 for each named executive officer per calendar year. We provide this perquisite to assist our executive officers in obtaining high-quality financial counseling enabling them to concentrate on business matters rather than on personal financial planning.
Executive Physicals. We pay for annual physicals for U.S.-basedour executive officers. We provide this perquisite to allow us to promptly identify and address medical issues and to preserve our investment in our executive officers by encouraging them to maintain healthy lifestyles and be proactive in addressing actual or potential health issues.their preventative healthcare.
Relocation Expense Reimbursement. We reimburse executive officers for expenses incurred in relocating at our request undermaintain a standardgeneral relocation policy availableunder which the Company provides reimbursement for certain relocation expenses to allnew employees and to employees whose job function requires his or her relocation. We believe it is important to maintain market competitive relocation benefits to ensure that we can fill positions that are critical to Nordson’s business needs. Executive officers are eligible to participate in accordancethe general program but at higher benefit levels consistent with Internal Revenue Service guidelines,external market practice. The relocation expenses may include moving expenses, temporary housing expenses, transportation expenses, home sale and gross up taxes leviedpurchase assistance and tax gross-ups on these payments. In lieu of direct reimbursement of expenses, Nordson may reimburse relocation expense reimbursement.expenses through cash sign-on bonuses or through the issuance of long-term incentive awards.
AttributedIn 2013, Mr. Merk relocated from Brazil to the United States. Relocation expenses paid in 2013 to or on Mr. Merk’s behalf as well as attributed costs of these perquisites for our named executive officers during 2011 are included in the “All Other Compensation” column of the Summary Compensation Table for Fiscal Year 2011.Table.
Welfare and Retirement Benefits
Medical, Disability and Life Insurance Benefits
Our U.S.-basedThe named executive officers have the opportunity to participate in the same tax-qualified retirement benefit programs available to all other United States-based salaried and non-union hourly employees. The Company’s retirement plans are designed to provide replacement income upon retirement and to be competitive with programs offered by our peers.
In addition, because the Internal Revenue Code limits the amount of benefits that can be contributed to and paid from a company-sponsored health care, disability and life insurancetax-qualified retirement plan, the Company also provides our executive officers with additional retirement benefits intended to restore amounts that would otherwise be payable under the Company’s tax-qualified retirement plans for U.S.-based employees.absent the Internal Revenue Code limits. We call these plans “restoration plans” because they restore total executive retirement benefits to the same percentage level provided to our salaried employees who are not limited by Internal Revenue Code restrictions.
Retirement Benefits
401(k) Plan. Our executive officers are eligible to participate in a company-sponsored 401(k) tax-qualified retirement savings plan for all U.S.-based employees. We match employee contributions $0.50
50
$0.50 on the dollar for the first 6% of contributed compensation. Employee contributions to the 401(k) plan vest immediately, while matching contributions vest in increments based on years of service, with participants being fully vested after three years of service.
The amounts of our matching contributions to the 401(k) plan accounts offor our named executive officers are included in the “All Other Compensation” column of the Summary Compensation Table for Fiscal Year 2011 in this Proxy Statement.
Non-Qualified Deferred Compensation Plan.Plan
We sponsormaintain a non-qualified, unfunded, and unsecured deferred compensation plan for U.S.-based executive officers.the benefit of eligible management employees who participate in our performance-based compensation programs and employees whose benefits under the 401(k) Plan are limited by the benefit restrictions of Section 415 of the Internal Revenue Code. We believe this type of plan helps us compete effectively for executive talent because many other companies offer this type of benefit.
Participants are able to defer up to 100% of their base salary and annual cash incentive plan payout, and up to 90% of their long-term incentive plan payout. In addition, participants are credited with non-qualified defined contribution retirement plan employer match equal to a maximum of 6% of their compensation in excess of the amount that may be considered under the 401(k) Plan. Participants are immediately vested in the matching contribution. Our compensation deferral plan is intended to comply with Section 409A of the Internal Revenue Code concerning deferred compensation arrangements.
A detailed description of our deferred compensation plan and information regarding contributions to those plans is provided in the “Non-Qualified Deferred Compensation for Fiscal Year 2011”Compensation” table and the accompanying narrative and footnotes in this Proxy Statement.
48
Defined Benefit Pension Plan. Our executive officers participate in a company-sponsored tax-qualified pension plan for U.S.-based salaried employees. The pension plan is designed to work together with social security benefits to provide employees with 30 years of service retirement income that is approximately 55% of eligible compensation, subject to the Internal Revenue Service maximum monthly benefit. A detailed description of our pension plans for U.S.-based employees is provided in the narrative and footnotes to the “Pension Benefits for Fiscal Year 2011”Benefits” table in this Proxy Statement.
Excess Defined Benefit Pension Plan. This supplemental executive retirement benefit restoration plan is an unfunded, non-qualified plan that is designed to provide retirement benefits to U.S.-based eligible participants as a replacement for those retirement benefits reducedlimited by regulations under the Internal Revenue Code. Together, the defined benefit pension plan and excess defined benefit pension plan are intended to provide executive officers with retirement income at a level equivalent to that provided to all other employees under the defined benefit pension plan.
Mr. Hilton is not vested for a benefit under the company-sponsored defined benefit pension plan until he has five years of service. As a negotiated element of his employment agreement, we agreed to provide Mr. Hilton a supplemental non-qualified pension benefit in order to provide Mr. Hilton a retirement benefit until he becomes vested in the defined benefit pension plan. Under this supplemental benefit plan, Mr. Hilton is treated as if he were fully vested in the pension plan, solely in the event that Mr. Hilton experiences a termination of employment due to death, disability, or without cause, or resignation with good reason (whether or not in connection with a change-in-control), as those terms are defined in the agreement, prior to becoming one hundred percent (100%) vested in the defined benefit pension plan. Once Mr. Hilton has accrued sufficient service to be fully vested, we have no obligation to provide thea benefit under this supplemental pension benefit.plan.
Severance Agreements
TheMr. Hilton is the only executive for which the company has any obligation we have to provide an executive officer withpay severance pay other than following a change-in-control is with Mr. Hilton.change-in-control. As part of the negotiated employment agreement with Mr. Hilton to become our President and Chief Executive Officer, and as was the caseconsistent with an agreement we had with his
51
predecessor, we agreed to provide Mr. Hilton with a cash severance benefitand other benefits in the event his employment is terminated by us without “Cause” or Mr. Hilton terminates his employment with us for “Good Reason.”
“Cause” for this purpose is defined as (i) commission of a felony or an act or series of acts that results in material injury to the business or reputation of the Company or any subsidiary; (ii) willful failure to perform duties of employment, if such failure has not been cured in all material respects within twenty (20) days after we give notice thereof; (iii) breach of any material term, provision or condition of employment, which breach has not been cured in all material respects within twenty (20) days after we give notice thereof,thereof; or (iv) material failure to comply with our Code of Ethics and Business Conduct.
“Good Reason” is defined as the occurrence of any of the following: (i) a material diminution in Mr. Hilton’s title, duties or responsibilities, without his prior written consent, (ii) a material diminution of Mr. Hilton’s annual base salary, without his prior written consent, (iii) a material failure by the Company to make available to Mr. Hilton executive compensation plans, employee pension plans, and employee welfare plans and other benefits and perquisites that provide opportunities to receive overall compensation and benefits and perquisites at least equal to the opportunities for overall compensation and benefits and perquisites that were available to Mr. Hilton immediately prior to the action by us constituting such failure, (iv) we require Mr. Hilton without his prior written consent, to be based at any office or location that requires a relocation greater than 50 miles from Westlake, Ohio without Mr. Hilton’s prior written consent, or (v) any material breach of the employment agreement by us.
49
Upon a termination by us without causeCause or by Mr. Hilton for good reason,Good Reason, in addition to payment of any accrued and unpaid compensation and benefits, Mr. Hilton is entitled to post-termination payments and benefits as follows:
(a)
an amount equal to (i) two (2) times his annual base salary at the rate in effect on the date of termination, plus (ii)and an amount equal to two (2) times the greater of:of (x) ninety percent (90%) of his annual base salary or (y) his target annual cash incentive payout payable in the fiscal year in which a termination occurs;payout;
(b) a pro-rated amount of his annual cash incentive for such fiscal year based upon actual performance in such fiscal year, as determined at the end of the applicable performance period;
(c) a pro-rata payout of awards granted Mr. Hilton under the Long-Term Incentive Planlong-term incentive plan for any performance period(s) not completed on the date of termination, based upon actual performance in each such applicable performance period, as determined at the end of the applicable performance period;
(d)
full vesting in his accrued benefit under the supplemental non-qualified pension benefit described above and full vesting of the restricted share grant made at the time he commenced employment with us or subsequent unvested common share grants; and
(e)
continuation of health care and welfare benefits for a period of twenty-four (24) months following the date of termination.
We will not gross-up any tax imposed upon any payment received by Mr. Hilton under his employment agreement.
Change-in-Control Agreements
We believe that the occurrence, or potential occurrence, of a change-in-control transaction in which we are the target could create substantial uncertainty regarding the continued employment of our executive officers. Therefore we have entered into change-in-control retention agreements with our executive officers in order to (i) retain these key executives during periods of uncertainty; (ii) enable these executives to evaluate, negotiate and execute a change-in-control transaction more objectively; (iii) encourage these executives to remain focused on running the business rather than seeking other employment in the event of a possible change-in-control; and (iv) preserve shareholder value by providing continuity of management during a transition period.
Upon the occurrence of a change-in-control, unvested stock option grants to executive officers vest immediately and any restrictions on share grants in effect on the date of a change-in-control lapse immediately. We believe that the accelerationbenefits provided under these agreements are appropriate and are consistent with our objective of vesting for stock optionsattracting and restricted shares is appropriate because, depending on the structure of a change-in-control transaction, continuing such awards may unnecessarily complicate a potentially beneficial transaction and it may not be possible to replace such awards with comparable awards of the acquiring company’s stock. The accelerated vesting also provides our executive officers and employee option holders with the same opportunities as our other shareholders who are free to realize the value created at the time of the transaction by selling their shares. We believe that accelerating these equity awards upon a change-in-control is appropriate to (i) minimize the risk that executive officers might favor a transaction based on the likely impact on the executive officer’s equity awards, (ii) increase the likelihood that executive officers will remain with us after becoming aware of a pending or threatened change-in-control, and (iii) address the increased likelihood that executives may be terminated by a successor through no fault of their own. With respect to the Long-Term Incentive Plan performance share units, payouts would be based on actual performance achieved as of the date of a change of control.
We believe that a termination by the executive for good reason in connection with a change-in-control transaction may be conceptually the same as a termination by us without cause in certainretaining highly qualified executives.
5052
circumstances. Recognizing that, in the context of aSeverance benefits payable under these change-in-control potential acquirers would otherwise have an incentive to constructively terminate our named executive officers’ employment to avoid paying severance, we believe it is appropriate to provide severance benefits in these circumstances as well. In the event of a change-in-control, executive officersagreements are entitled to a gross-up for any excise taxes imposed on the change-in-control benefits by federal income tax laws. We believe that the mitigation of the cost of excise taxes for our executive officers is necessary to preserve the benefits to which they are entitled. This approach protects the value of compensation already awarded to the executive officers, and eliminates any potential personal bias against a change-in-control transaction.
We believe our change-in-control policy allows us to be competitive in this aspect of our compensation program. We consider the benefits offered under the retention agreements to be reasonable and appropriate for executive officers who may not be in a position to obtain readily comparable employment. We do not believe that named executive officers should be entitled to receive cash severance benefits merely because a change-in-control transaction occurs. The payment of cash severance benefits is only realized onlyconditioned upon the occurrence of a “double trigger” — an actual or constructiveevent (meaning there must beboth a change-in-control of the Company and, within the following 24 months, a termination of employment within two yearsby either the Company without Cause, or by the officer for Good Reason). We opted for a double-trigger, rather than a “single trigger” that provides for severance payments solely on the basis of a change-in-control, since a double trigger is consistent with the purpose of encouraging the continued employment of the executive following a change-in-control.
OurIn the event that the conditions for payment of severance compensation are met, the officer will be entitled to receive:
A lump sum payment in an amount equal to two (2) times the sum of (x) annual base salary in effect at the time of termination of employment plus (y) target payout of annual cash incentive for the year in which termination of employment occurs;
The continuation of coverage for the executive officer and his eligible spouse and dependents under the Company’s group health plans for 24 months following termination of employment or until the date he becomes covered under similar benefit plans;
Professional outplacement services; and
Two additional years of age and two additional years of service credit under the Excess Defined Benefit Pension Plan.
In certain instances, payments made to an executive officer due to a termination following a change-in-control may be subject to federal excise tax. We provide the executive officer with a tax gross-up payment to offset the effect of the excise tax. We provide for these payments because they allow an executive to recognize the full intended economic benefit of the agreement and eliminate unintended disparities between executives that the excise tax can arbitrarily impose, owing to the particular structure of this tax provision.
For more details regarding the terms and conditions of these change-in-control agreements, and the associated potential payments and benefits are discussedsee “Potential Benefits Upon Termination” later in detail under the “Potential Payments Upon Termination or Change-in-Control” section of this Proxy Statement.
PART III: COMPENSATION COMMITTEE ACTIONS RELATED TO FISCAL YEAR 20122014
EXECUTIVE COMPENSATION
We engaged Exequity Inc., our independent executive compensation consultant, to assist us in establishing 20122014 compensation for our named executive officers. We also reviewed the peer group and with Exequity’s assistance, revised the peer group to better reflect our business model and the companies with which we compete for executive talent. During our meeting on November 28, 2011 meeting,25, 2013, and after considering the recommendations of Exequity, Inc., we set 20122014 base salaries and incentive compensation opportunities and financial performance measures. The base salary increases for the named executive officers range from 3.57%3.1% to 6.00%6.7%.
We have adopted a new definition of return on capital that is consistent with financial disclosure in our Form 10-K Report: Net income (loss), plus after-tax interest expense on debt as a percentage of average quarterly debt (net of cash) plus average quarterly shareholders’ equity over five accounting periods.
Performance measures for the quantitative corporate financial element of the Annual Cash Incentive Plan payoutannual cash incentive program are:
Measure | Threshold | Target | Maximum | Threshold | Target | Maximum | ||||||
Return on Capital | 8.0% | 11.5% | 16.0% | 8% | 11.5% | 16% | ||||||
Diluted Earnings per Share Growth | 0% | 10% | 20% | 0% | 10% | 20% | ||||||
— Equivalent Amount per Share | $3.25 | $3.58 | $3.90 | $3.42 | $3.76 | $4.10 |
We also established the following threshold, target, and maximum cumulative diluted earnings per share growth and cumulative revenue growth performance goals for the 2012-2014 Long-Term Incentive Plan2014-2016 long-term incentive program performance share unit awards:
Measure | Threshold | Target | Maximum | Threshold | Target | Maximum | ||||||
Cumulative Diluted Earnings per Share Growth | 4% | 8% | 14% | 4% | 8% | 14% | ||||||
— Equivalent Amount per Share | $10.55 | $11.39 | $12.74 | $11.10 | $11.99 | $13.41 | ||||||
Cumulative Revenue Growth | 5% | 7% | 11% | 5% | 7% | 11% | ||||||
— Equivalent Revenue Levels | $4,082,000 | $4,242,000 | $4,575,000 | |||||||||
— Equivalent Revenue Levels (000’s) | $5,107,200 | $5,307,500 | $5,723,700 | |||||||||
5153
We granted stock options, performance share units for the 2012-2014 Long-Term Incentive Plan,2014-2016 long-term incentive awards, and restricted shares to our executive officers consistent with our equity grant policy in the following amounts:
Named Executive Officer | Options (# Shares) | Performance Share Units at Target (#) | Restricted Shares (#) | Options (# Shares) | Performance Share Units at Target (#) | Restricted Shares (#) | ||||||||||||||||||
Michael F. Hilton | 55,000 | 20,000 | 10,000 | 42,700 | 14,600 | 7,300 | ||||||||||||||||||
Gregory A. Thaxton | 13,000 | 4,500 | 2,300 | 11,000 | 3,700 | 1,800 | ||||||||||||||||||
John J. Keane | 16,000 | 6,000 | 3,000 | 11,500 | 3,900 | 1,900 | ||||||||||||||||||
Peter G. Lambert | 10,500 | 3,900 | 2,000 | 8,400 | 2,900 | 1,400 | ||||||||||||||||||
Douglas C. Bloomfield | 10,000 | 3,500 | 1,800 | |||||||||||||||||||||
Gregory P. Merk | 7,600 | 2,600 | 1,300 | |||||||||||||||||||||
PART IV: POLICIES RELATED TO EXECUTIVE COMPENSATION
Equity Grant Policy
We make equity grants on a consistent schedule, generally at the first Compensation Committee meeting following the close of the fiscal year, to permit us to confirm prior fiscal year performance andperformance. We do not grant long-term incentive awards, stock options or restricted stockshares to our executive officers in anticipation of the release of significant earnings announcements or other material non-public information likely to result in changes to the price of our common shares. Similarly, we do not time the release of material non-public information based on stock option and restricted stockequity grant dates. Awards are effective on the date that we grant the award.award and the exercise/grant price is equal to the closing price of the Nordson common shares on that date. The Committee may also make occasional grants of stock options and other equity-based awards at other times to recognize, retain or recruit executive officers and key employees. We have delegated limited authority to Mr. Hilton to approve equity awards, excluding grants made to executive officers. Equity grants approved by Mr. Hilton in any quarter will be effective the first day of the month following public disclosure of quarterly earnings for that quarter. In the event the effective date of the grant is a Saturday, Sunday or holiday, the effective date of grant will be the first subsequent day our common shares are traded. Such grants will be reported to the Compensation Committee at its next regularly scheduled meeting. In 2011,2013, Mr. Hilton approved the grant of a total of 9,5001,900 shares of restricted shares and 5,000 stock options to non-executive officer employees.
The grants are subjectIncentive Compensation Forfeiture (Clawback) Policy
We have a formal “clawback” policy for incentive awards that is broader in its reach than that imposed by Section 304 of the Sarbanes-Oxley Act (“SOX”). Under the policy, we may require our executive officers to (i) profit recapture (commonly known asrepay cash-based incentive compensation and/or forfeit equity incentive awards in the event of a “clawback”) whenmaterial restatement of the consolidated financial statements of the Company, other than any restatement required pursuant to a change in applicable accounting rules. Recovery is limited to amounts paid or realized by an executive officer acts inconsistently withduring the non-compete provision of his or her employee agreement following termination of employment, or (ii) forfeiturethree-year period preceding the date that we are required to prepare a restatement.
Also, in the event the Committee determines that an executive officer’s employment is terminated due to a criminal act, fraud or other such behavior inconsistent withofficer has engaged in (i) conduct that violates our Code of Ethics and Business Conduct. The invokingConduct, or (ii) willful misconduct or fraud that causes harm to the Company, our Board of Directors, upon the Compensation Committee’s recommendation, may, to the extent permitted by law and to the extent it determines that it is in our best interests to do so, require reimbursement or payment by the executive officer to the Company of equity-based compensation and performance-based compensation in an amount determined by the Board of Directors to be attributable to such conduct described in (i) and (ii) above.
By way of comparison, the clawback imposed by Section 304 of SOX is limited to the chief executive officer and chief financial officer and is based on material noncompliance by the issuer, as a result of misconduct, with any financial reporting obligation under the federal securities laws where such noncompliance requires the issuer to restate its financials. The SOX provision looks back one year and
54
requires the issuer to recover all bonus or forfeiture provisionincentive-based or equity-based compensation paid to the chief executive officer and chief financial officer (in cases of misconduct). The Committee is solely at our discretion. To date, we have not hadmonitoring this policy to ensure that it is consistent with applicable laws, including any requirements under the need to exercise our discretion in seeking profit recapture or forfeiture from any former executive officer. We intend to revise our clawback policy covering our annualDodd-Frank Wall Street Reform and long-term incentive award plans and arrangements, if necessary, once the Securities and Exchange Commission adopts the final implementing rules.
Our policy also prohibits Nordson employees from engaging in any transactions involving a derivative of a Nordson security, including hedging transactions.Consumer Protection Act.
Share Ownership Guidelines
We require share ownership by our executive officers to emphasize our executive compensation program’s objective of aligning the individual financial interests of our executive officers with the investment interests of our long-term shareholders. We require our executive officers to own the following multiples of base salary in the equivalent number of common shares:
Chief Executive Officer | 5 times base salary | |
President (if other than the | 3 times base salary | |
Other Executive Officers | 2 times base salary |
52
The number of shares required to be held varies according to our common share price movement. Newly elected or promoted executive officers will have up to five years to meet the ownership requirements after their election or promotion.
Executive officers who have not satisfied the share ownership requirements by the end of the five-year period or who have not shown progress (as subjectively determined by the Committee) toward the required ownership level prior to the end of such five-year period will be expected to retain 100% of the shares acquired through exercise of options, lapse of transfer restrictions on restricted shares or long-term incentive performance share awards, net of shares tendered to cover the taxes due or the lapse of a restriction period until the share ownership requirement is achieved or there is progress towards the ownership requirement. We review the actual share ownership of each executive officer compared to the applicable share ownership guideline, including the number of vested stock options, share equivalent units in deferred compensation plans and share ownership in the Nordson Corporation Employee Stock Ownership and 401(k) Plans, each of which count as valid forms of share ownership under the ownership guidelines. As of October 31, 2011,2013, all named executive officers who have been executive officers for five years meet the ownership guidelines. Mr. Hilton has three years as of the date of this Proxy Statement to achieve the share ownership equal to five times his base salary and is demonstrating progress in doing so.
Accounting and Tax ConsiderationsAnti-Pledging/Anti-Hedging Policy
We continuously reviewprohibit directors and evaluateexecutive officers from pledging Nordson common shares as collateral. Also prohibited is trading in derivative securities of Nordson’s common shares, engaging in short sales of Nordson securities, or purchasing any other financial instruments (including prepaid variable forward contracts, equity swaps, collars and exchange funds) that are designed to hedge or offset any decrease in the impactmarket value of tax laws, accounting changes and similar factors affecting our executive compensation program. For example, the enactmentNordson securities.
Deductibility of Section 409A of the Internal Revenue Code, which impacts deferred compensation arrangements, is considered when we contemplate future changes to the program.Executive Compensation
In the course of fulfilling our responsibilities, we routinely review the impact of Section 162(m) of the Internal Revenue Code which disallowssets a tax deductionlimit of $1,000,000 on the amount we can deduct for certain compensation paid in excessto each of $1,000,000 to the Chief Executive Officer and the next three highest paidother most highly compensated executive officers of the Company, excludingother than the Chief Financial Officer. The regulationsCompensation that qualifies as “performance-based” compensation under Section 162(m), however, exempt from this does not count toward the $1,000,000 limit various formslimit. Our general philosophy is to attempt to qualify future compensation for tax deductibility under Section 162(m) of the U.S. Internal Revenue Code, wherever appropriate, recognizing that, under certain circumstances, the limitations may be exceeded. Qualification is sought to the extent practicable and only to the extent that it is consistent with our overall compensation including “performance-based” compensation. objectives.
Our Annual Cash Incentive Plan, stock options and performance share units werecurrent incentive compensation plans are intended to qualify as “performance-based”allow the annual cash incentive and long-term incentive compensation but our restricted shares were not. We have established a requirement that, if necessary, executive officers will defer base salary and payoutsto be excluded in determining deductibility under the Annual Cash Incentive Plan and Long-Term Incentive Plan to avoid the lossSection 162(m). Exclusion of deductibility.
Although we carefully consider the impact ofthose amounts under Section 162(m) when administeringmeans that they are fully deductible, regardless of amount, assuming they are otherwise considered reasonable compensation and are within the Company’s compensation programs, we do not make decisions regarding executive compensation solely based on the expected tax treatmentlimits of such compensation. In order to maintain flexibility in designing compensation programs that attract and retain key leaders, reward past performance, create an incentive for strong future performance and align executives’ interests with those of the Company’s long-term shareholders, we may deem it appropriate at times to forgo Section 162(m) qualified awards in favor of awards that may not be fully tax-deductible.
5355
the plans. Payments of base pay and restricted shares (as currently structured) would not be excludable and, thus, the payment of those amounts in excess of $1,000,000 in one fiscal year would, generally, be non-deductible.
We have reviewed and discussed with management the Compensation Discussion and Analysis that appears in this Proxy Statement. Based on such review and discussion, we recommended to the Board of Directors that the Compensation Discussion and Analysis be included in the Company’s definitive Proxy Statement on Schedule 14A and incorporated by reference into the Company’s Annual Report on Form 10-K for the Fiscal Yearfiscal year ended October 31, 2011,2013, each as filed with the Securities and Exchange Commission.SEC.
Compensation Committee
Mary G. Puma, Chairperson
Lee C. Banks
Joseph P. Keithley
WilliamVictor L. RobinsonRichey, Jr.
January 23, 201217, 2014
The above Compensation Committee Report does not constitute soliciting material and should not be deemed filed with the Securities and Exchange CommissionSEC or subject to Regulation 14A or 14C (other than as provided in Item 407 of Regulation S-K) or to the liabilities of Section 18 of the Securities Exchange Act, of 1934 (the “Exchange Act”), except to the extent that the Company specifically requests that the information in this Report be treated as soliciting material or specifically incorporates it by reference into a document filed under the Securities Act of 1933 (the “Securities Act”) or the Exchange Act. If this Report is incorporated by reference into the Company’s Annual Report on Form 10-K, such disclosure will be furnished in such Annual Report on Form 10-K and will not be deemed incorporated by reference into any filing under the Securities Act or the Exchange Act as a result of furnishing the disclosure in this manner.
5456
RISKS RELATED TO EXECUTIVE COMPENSATION POLICIES AND PRACTICES
The Compensation Committee believes that the design of the executive compensation program as outlined in the “Compensation Discussion and Analysis” above places emphasis on long-term incentives and competitive base salaries. While the annual cash incentive plan is tied to short-term performance, the Committee concluded that emphasis on long-term incentives appropriately balances risk and management’s motivations for our long-term success, including share price performance, with the interests of the our long-term shareholders. Although our program is designed to pay-for-performance and provide incentive-based compensation, the incentive-driven elements of our compensation program contain various mitigating features to ensure management is not encouraged to take unnecessary risks in managing the business that could maximize short-term results at the expense of long-term value. These factors include:
Oversight of the program by the Compensation Committee;
Discretion is provided to the Compensation Committee to set targets, and monitor performance, and the ability to exercise negative discretion in settingdetermining incentive plan payouts to our executive officers;officers.
Base salaries are fixed in amount and thus do not encourage risk taking;
A mixture of both short- and long-term goals and a mixture of cash and equity compensation;
Both the annual incentive plan and the performance share units utilize more than one performance measure to minimize risk;
Consistently approving payout amounts that are below maximum payouts permitted under the annual cash incentive and long-term incentive plans;
Service-based vesting conditions with respect to equity grants;
Share ownership guidelines to align the executive interests with those of our long-term shareholders; and
Forfeiture and profit recapture (“clawback”) terms that accompany stock option grants.
Based upon this analysis, weWe believe that our compensation policies and practices do not encourage our executive officers to take excessive or unnecessary risks and are not reasonably likely to have a material adverse effect on the Company.
The table below summarizes the risk mitigation factors applicable to the primary elements of the Company’s executive compensation plans.
Base Salary Risk Mitigation Factors
Fixed Amount. Base salary does not encourage risk-taking as it is a fixed amount.
Small Percentage of Total Compensation. Base salary is a relatively small percentage of total direct compensation for executive officers.
55
Annual Cash Incentive Risk Mitigation Factors
Multiple Performance Factors. The annual cash incentive plan uses multiple performance factors that encourage executives to focus on the overall strength of the business rather than a single financial measure.
Award Cap. Awards payable to any individual are capped.
Management Processes. Board and management processes are in place to oversee risk associated with the annual cash incentive plan, including, but not limited to, monthly and quarterly business performance reviews by management and regular business performance reviews by the Board of Directors and the Audit Committee.
Clawback Provision. Robust forfeiture (“clawback”) terms accompany cash-based incentive awards for our executive officers.
Long-Term Equity Compensation Risk Mitigation Factors
Share Ownership Guidelines. Share ownership guidelines align the executive interests with those of our long-term shareholders.
Vesting Schedule Overlaps. The vesting schedules for long-term incentives overlap and, therefore, reduce an executive officer’s motivation to maximize performance in any one period.
Service-based Vesting. Service-based vesting conditions with respect to equity grants encourage alignment with long-term shareholder interests.
Anti-Hedging/Anti-Pledging Policy. The Company’s anti-hedging policy prohibits directors and our executive officers from purchasing any financial instrument that is designed to hedge or offset any decrease in the market value of our common stock, including prepaid variable forward contracts, equity swaps, collars and exchange funds. Our anti-pledging policy prohibits our Directors and executive officers from pledging our common stock as collateral.
Clawback Provision. Robust forfeiture (“clawback”) terms accompany equity-based incentive awards for our executive officers.
57
SUMMARY COMPENSATION FOR FISCAL YEAR 20112013
All references in this section to years are references to fiscal years unless otherwise noted. Our fiscal year ends October 31.
The following narratives, tables, footnotes and supplemental tables present the components of compensation for our named executive officers for the Fiscal Yearfiscal year ended October 31, 2011.2013. The individual components of the compensation reflected in the Summary Compensation Table (SCT)(“SCT”) for Fiscal Year 20112013 are:
Salary. Base salary earned by a named executive officer during Fiscal Year 2011.2013. Any amount of base salary deferred by a named executive officer is identified in footnote 1 to the table.
Bonus. We did not award any non-performance-based discretionary cash incentivesbonus to our named executive officers for Fiscal Year 2011.2013.
Stock Awards. The awards disclosed in the “Stock Awards” column consist of restricted share grants and performance share grants for the Fiscal Year 2009-2011, 2010-20122013-2015, 2012-2014, and 2011-2013 performance periods. The calculations are based upon the grant date fair value of restricted shares and performance share units as calculated under FASB ASC Topic 718 (formerly known as FAS 123R) for Fiscal Years 2011, 20102013, 2012, and 2009.2011. Details about Long-Term Incentive Plan awards are included in the narrative accompanying the “Grants of Plan-Based Awards During Fiscal Year 2011”Awards” table below. For performance share awards, grant date fair value disclosed in the SCT is based on the level at which the award is expected to pay out, rather than at the maximum possible payout. The maximum payout appears in a footnote to the table.
Option Awards. The awards disclosed in the “Option Awards” column consist of option grants for our common stock. The award amounts represent the grant date fair value of stock options as calculated under FASB ASC Topic 718 (formerly known as FAS 123R) for each named executive officer.718. Details about the option awards made during Fiscal Year 20112013 are included in the narrative accompanying the “Grants of Plan-Based Awards During Fiscal Year 2011”Awards” table.
Non-Equity Incentive Plan Compensation. The amounts disclosed under the “Non-Equity Incentive Plan Compensation” column represent compensation earned under the Annual Cash Incentive Plan. Further information concerning the Annual Cash Incentive Plan may be reviewed in Part II of the Compensation Discussion and Analysis section of this Proxy Statement under the caption “Annual Incentive Compensation.”
Change in Pension Value. The amounts disclosed in the “Change in Pension Value and Non-Qualified Deferred Compensation Earnings” column represent solely any actuarial increase during the fiscal year in the pension value provided under our qualified defined benefit pension plan and non-qualified excess defined benefit pension plan. We do not pay above-market or preferential rates on the non-qualified deferred compensation of our named executive officers. A narrative discussion of our defined benefit pension plan and excess defined benefit pension plan and the estimated present value of the accumulated benefits accompanies the “Pension Benefits for Fiscal Year 2011”Benefits” table.
All Other Compensation. The amounts disclosed in the “All Other Compensation” column include the combined value of the named executive officer’s perquisites, our matching contributions to the qualified deferred compensation 401(k) plan and non-qualified deferred compensation plan and other noted payments.
5658
Summary Compensation Table For Fiscal Year 2011
In this section we provide certain tabular and narrative information regarding the compensation of our principal executive and financial officers and our three other most highly compensated executive officers for the Fiscal Year ended October 31, 2011.2013.
Name and Principal Position | Fiscal Year | Salary (1) $ | Bonus $ | Stock Awards (2) $ | Option Awards (3) $ | Non-Equity Incentive Plan Compen- sation (4) $ | Change in Pension Value & Non- Qualified Deferred Compensation Earnings (5) $ | All Other Compen- sation (6) $ | Total $ | |||||||||||||||||||||||||||
Michael F. Hilton | 2011 | 700,000 | — | 1,146,150 | 859,250 | 1,400,000 | 359,825 | 50,044 | 4,515,269 | |||||||||||||||||||||||||||
| President and Chief Executive Officer | 2010 | 534,375 | — | 931,307 | 873,877 | 961,876 | 82,031 | 756,374 | 4,139,840 | |||||||||||||||||||||||||||
Gregory A. Thaxton | 2011 | 330,000 | — | 254,700 | 195,909 | 396,000 | 483,963 | 24,467 | 1,685,039 | |||||||||||||||||||||||||||
| Vice President and Chief Financial Officer | 2010 | 308,000 | — | 281,926 | 168,150 | 338,800 | 171,015 | 12,961 | 1,280,852 | |||||||||||||||||||||||||||
| 2009 | 254,269 | — | 124,315 | 142,266 | — | 334,151 | 26,936 | 881,937 | ||||||||||||||||||||||||||||
John J. Keane | 2011 | 330,000 | — | 356,580 | 274,960 | 473,550 | 509,572 | 28,608 | 1,973,270 | |||||||||||||||||||||||||||
Senior Vice President | 2010 | 318,000 | — | 403,270 | 264,556 | 445,200 | 239,158 | 19,078 | 1,689,262 | |||||||||||||||||||||||||||
| 2009 | 301,153 | — | 211,600 | 246,522 | — | 425,228 | 28,933 | 1,213,436 | ||||||||||||||||||||||||||||
Peter G. Lambert | 2011 | 285,000 | — | 237,633 | 182,161 | 324,900 | 412,481 | 150,298 | 1,592,473 | |||||||||||||||||||||||||||
Senior Vice President | 2010 | 268,000 | — | 236,607 | 147,972 | 321,600 | 117,014 | 16,217 | 1,107,410 | |||||||||||||||||||||||||||
| 2009 | 222,923 | — | 105,800 | 123,804 | — | 271,602 | 23,981 | 748,110 | ||||||||||||||||||||||||||||
Douglas C. Bloomfield | 2011 | 250,000 | — | 203,760 | 161,539 | 268,125 | 470,955 | 24,653 | 1,379,032 | |||||||||||||||||||||||||||
Vice President | 2010 | 238,000 | — | 212,163 | 136,762 | 261,800 | 131,686 | 24,324 | 1,004,735 | |||||||||||||||||||||||||||
Name and Principal Position | Fiscal Year | Salary (1) $ | Bonus $ | Stock Awards (2) $ | Option Awards (3) $ | Non-Equity Incentive Plan Compen- sation (4) $ | Change in Pension Value & Non- Qualified Deferred Compensation Earnings (5) $ | All Other Compen- sation (6) $ | Total $ | |||||||||||||||||||||||||||
Michael F. Hilton | 2013 | 775,000 | — | 1,446,160 | 1,051,974 | 775,000 | 282,419 | 98,897 | 4,429,450 | |||||||||||||||||||||||||||
| President and Chief Executive Officer | 2012 | 725,000 | — | 1,279,700 | 950,543 | 1,016,088 | 537,215 | 73,649 | 4,582,195 | |||||||||||||||||||||||||||
| 2011 | 700,000 | — | 1,146,150 | 859,250 | 1,400,000 | 359,825 | 50,044 | 4,515,269 | ||||||||||||||||||||||||||||
Gregory A. Thaxton | 2013 | 375,000 | — | 367,499 | 269,110 | 243,750 | 47,933 | 36,599 | 1,339,891 | |||||||||||||||||||||||||||
| Senior Vice President and Chief | 2012 | 345,000 | — | 290,119 | 224,674 | 325,499 | 653,505 | 32,513 | 1,871,310 | |||||||||||||||||||||||||||
Financial Officer | 2011 | 330,000 | — | 254,700 | 195,909 | 396,000 | 483,963 | 24,467 | 1,685,039 | |||||||||||||||||||||||||||
John J. Keane | 2013 | 367,000 | — | 397,694 | 291,128 | 177,261 | — | 41,701 | 1,274,784 | |||||||||||||||||||||||||||
Senior Vice President | 2012 | 345,000 | — | 383,910 | 276,522 | 362,612 | 538,204 | 309,631 | 2,215,879 | |||||||||||||||||||||||||||
| 2011 | 330,000 | — | 356,580 | 274,960 | 473,550 | 509,572 | 28,608 | 1,973,270 | ||||||||||||||||||||||||||||
Peter G. Lambert | 2013 | 320,000 | — | 280,194 | 207,948 | 137,760 | — | 27,737 | 973,639 | |||||||||||||||||||||||||||
Senior Vice President | 2012 | 300,000 | — | 251,728 | 181,467 | 225,270 | 409,057 | 19,783 | 1,387,305 | |||||||||||||||||||||||||||
| 2011 | 285,000 | — | 237,633 | 182,161 | 324,900 | 412,481 | 150,298 | 1,592,473 | ||||||||||||||||||||||||||||
Gregory P. Merk | 2013 | 289,000 | — | 256,158 | 185,930 | 128,750 | 476,663 | 166,141 | 1,502,642 | |||||||||||||||||||||||||||
Senior Vice President | 2012 | 260,000 | — | 226,134 | 172,826 | 193,265 | — | 15,116 | 867,341 | |||||||||||||||||||||||||||
| (1) | This column includes amounts of base salary |
| (2) | This column represents the grant date fair value of restricted shares and performance share units as calculated under FASB ASC Topic |
Named Executive Officer | Fiscal Year | Maximum Performance Share Payout (Units) | Maximum Performance Share Payout ($) | Fiscal Year | Maximum Performance Share Payout (Units) | Maximum Performance Share Payout ($) | ||||||||||||||||||
Michael F. Hilton | 2011 | 36,000 | 1,512,540 | 2013 | 32,000 | 1,906,880 | ||||||||||||||||||
| 2010 | 48,868 | 1,442,583 | 2012 | 40,000 | 1,684,800 | |||||||||||||||||||
| 2011 | 36,000 | 1,512,540 | ||||||||||||||||||||||
Gregory A. Thaxton | 2011 | 8,000 | 336,120 | 2013 | 8,200 | 488,638 | ||||||||||||||||||
| 2012 | 9,000 | 379,080 | ||||||||||||||||||||||
| 2010 | 12,000 | 313,140 | 2011 | 8,000 | 336,120 | |||||||||||||||||||
| 2009 | 18,800 | 248,630 | ||||||||||||||||||||||
John J. Keane | 2011 | 11,200 | 470,568 | 2013 | 8,800 | 524,392 | ||||||||||||||||||
| 2010 | 16,000 | 417,520 | 2012 | 12,000 | 505,440 | |||||||||||||||||||
| 2009 | 32,000 | 423,200 | 2011 | 11,200 | 470,568 | |||||||||||||||||||
Peter G. Lambert | 2011 | 7,600 | 319,314 | 2013 | 6,200 | 369,458 | ||||||||||||||||||
| 2010 | 9,400 | 245,293 | 2012 | 7,800 | 328,536 | |||||||||||||||||||
| 2009 | 16,000 | 211,600 | 2011 | 7,600 | 319,314 | |||||||||||||||||||
Douglas C. Bloomfield | 2011 | 6,400 | 268,896 | |||||||||||||||||||||
| 2010 | 8,400 | 219,198 | ||||||||||||||||||||||
Gregory P. Merk | 2013 | 5,600 | 333,704 | |||||||||||||||||||||
| 2009 | 16,000 | 211,600 | 2012 | 7,000 | 294,840 | |||||||||||||||||||
| (3) | This column represents the grant date fair value of the stock option award as calculated under FASB ASC Topic 718 |
57
| Awards” table below. The aggregate grant date fair value may not correspond to the actual value that may be recognized by the named executive officer. The actual amount, if any, realized upon the exercise of stock options will depend upon the market price of our common shares relative to the exercise price per share of the stock option at the time of exercise. |
59
The table below lists the assumptions used in Fiscal Year 20112013 to estimate the grant date fair value of thestock options granted to the named executive officers and included in this column as of October 31, 2011:2013:
Fiscal Year | Number of Share Granted | Exercise Price | Expected Life (in years) | Dividend Yield | Volatility | Risk-Free Rate | Number of Shares Granted | Exercise Price | Expected Life (in years) | Dividend Yield | Volatility | Risk-Free Rate | ||||||||||||||||||||||||||||||||||||
2007 | 204,800 | 24.39 | 7.8 | 1.64 | % | 0.2849 | 4.57 | % | ||||||||||||||||||||||||||||||||||||||||
2008 | 179,900 | 26.46 | 6.1 | 1.41 | % | 0.261 | 3.62 | % | ||||||||||||||||||||||||||||||||||||||||
2009 | 301,200 | 14.37 | 6.2 | 1.36 | % | 0.4038 | 1.76 | % | 301,200 | $ | 14.37 | 6.2 | 1.36 | % | 0.404 | 1.76 | % | |||||||||||||||||||||||||||||||
2010 | 133,218 | 29.05 | 6.2 | 1.37 | % | 0.4295 | 3.03 | % | 133,218 | $ | 29.05 | 6.2 | 1.37 | % | 0.429 | 3.03 | % | |||||||||||||||||||||||||||||||
2011 | 97,400 | 43.32 | 6.3 | 1.28 | % | 0.4311 | 2.25 | % | 97,000 | $ | 43.32 | 6.3 | 1.28 | % | 0.431 | 2.25 | % | |||||||||||||||||||||||||||||||
2012 | 104,500 | $ | 43.73 | 6.1 | 1.20 | % | 0.454 | 1.23 | % | |||||||||||||||||||||||||||||||||||||||
2013 | 82,000 | $ | 61.59 | 6.1 | 1.01 | % | 0.453 | 0.90 | % | |||||||||||||||||||||||||||||||||||||||
The assumptions listed in the above table differ slightly from those presented in Note 11,15, Stock-based Compensation to the consolidated financial statements included in our Annual ReportsReport on Form 10-K for the Fiscal Year ended October 31, 2011.2013. The assumptions in Note 11 are determined by the vesting period for stock option grants to executive officers — 4 years —15 represent all grantees and to all other grantees — 5 years.grant dates during each year.
See the “Grants of Plan-Based Awards During Fiscal Year 2011”Awards” table for information with respect to the stock options granted in Fiscal Year 20112013 and the “Outstanding Equity Awards at Fiscal 2011 Year End”Awards” table for information with respect to the stock options granted prior to Fiscal Year 2011.2013.
| (4) | The amounts in this column represent the total non-equity incentive plan compensation we recognized in the respective fiscal year under our Annual Cash Incentive |
| (5) | The amounts entered in this column |
The following table provides further details to the increases or decreases by plan for 2011:2013:
Named Executive Officer | Change in Pension Plan Value ($) | Change in Excess Pension Plan Value ($) | Total ($) | Change in Pension Plan Value ($) | Change in Excess Pension Plan Value ($) | Total ($) | ||||||||||||||||||
Michael F. Hilton | 61,413 | 298,412 | 359,825 | 25,899 | 256,520 | 282,419 | ||||||||||||||||||
Gregory A. Thaxton | 166,098 | 317,865 | 483,963 | (75,353 | ) | 123,286 | 47,933 | |||||||||||||||||
John J. Keane | 146,189 | 363,383 | 509,572 | (61,129 | ) | (50,241 | ) | (111,370 | ) | |||||||||||||||
Peter G. Lambert | 144,159 | 268,322 | 412,481 | (55,083 | ) | 31,500 | (23,583 | ) | ||||||||||||||||
Douglas C. Bloomfield | 191,216 | 279,739 | 470,955 | |||||||||||||||||||||
Gregory P. Merk | 16,680 | 459,983 | 476,663 | |||||||||||||||||||||
| (6) | The following tables describe each component of the “All Other Compensation” column in the Summary Compensation |
Named Executive | Total Perquisites ($)(a) | Relocation Assistance ($)(b) | Tax Gross- Up Related to Relocation Assistance ($) | Company Contribu- tions to Tax- Qualified and Non-Qualified Plans ($) | Dividends Related to Share Based Plans ($) | Company Match of Charitable Contributions ($)(c) | Total All Other Compensation ($) | |||||||||||||||||||||
Michael F. Hilton | 13,495 | — | — | 19,479 | 6,970 | 10,100 | 50,044 | |||||||||||||||||||||
Gregory A. Thaxton | 7,093 | — | — | 9,467 | 2,633 | 5,274 | 24,467 | |||||||||||||||||||||
John J. Keane | 5,000 | — | — | 13,391 | 4,187 | 6,030 | 28,608 | |||||||||||||||||||||
Peter G. Lambert | 5,000 | 128,868 | 4,997 | 7,897 | 2,386 | 1,150 | 150,298 | |||||||||||||||||||||
Douglas C. Bloomfield | 5,300 | — | — | 9,315 | 2,138 | 7,900 | 24,653 | |||||||||||||||||||||
Named Executive Officer | Total Perquisites ($) (a) | Relocation Assistance ($) (b) | Tax Gross- Up Related to Relocation Assistance ($) | Company Contribu- tions to Tax- Qualified and Non-Qualified Plans ($) | Dividends Related to Share Based Plans ($) | Company Match of Charitable Contributions ($) | Total All Other Compensation ($) | |||||||||||||||||||||
Michael F. Hilton | 11,666 | — | — | 64,113 | 12,157 | 10,961 | 98,897 | |||||||||||||||||||||
Gregory A. Thaxton | 5,979 | — | — | 22,508 | 3,308 | 4,804 | 36,599 | |||||||||||||||||||||
John J. Keane | 7,918 | — | — | 23,650 | 3,686 | 6,447 | 41,701 | |||||||||||||||||||||
Peter G. Lambert | 5,000 | — | — | 18,841 | 2,796 | 1,100 | 27,737 | |||||||||||||||||||||
Gregory P. Merk | 950 | 140,190 | 19,854 | 2,600 | 2,547 | — | 166,141 | |||||||||||||||||||||
58
| (a) | Total perquisites for |
Named Executive Officer | Financial Planning ($) | Club Dues ($) | Executive Physicals ($) | Total Perquisites ($) | Financial Planning ($) | Club Dues ($) | Executive Physicals ($) | Total Perquisites ($) | ||||||||||||||||||||||||
Michael F. Hilton | 5,000 | 5,430 | 3,065 | 13,495 | 5,000 | 4,785 | 1,881 | 11,666 | ||||||||||||||||||||||||
Gregory A. Thaxton | 4,700 | 400 | 1,993 | 7,093 | 4,400 | 425 | 1,154 | 5,979 | ||||||||||||||||||||||||
John J. Keane | 5,000 | — | — | 5,000 | 5,000 | — | 2,918 | 7,918 | ||||||||||||||||||||||||
Peter G. Lambert | 5,000 | — | — | 5,000 | 5,000 | — | — | 5,000 | ||||||||||||||||||||||||
Douglas C. Bloomfield | 4,900 | 400 | — | 5,300 | ||||||||||||||||||||||||||||
Gregory P. Merk | 950 | — | — | 950 | ||||||||||||||||||||||||||||
| (b) | Mr. |
60
GRANTS OF PLAN-BASED AWARDS DURING FISCAL YEAR 2011
We granted the following type of awards to our executive officers in 2011:2013:
Annual Cash Incentive Awards —The Compensation Committee establishes quantitative performance measures for the corporate financial elementperformance at the beginning of a fiscal year. Any payouts are determined by actual fiscal year performance against the measures, and pre-established business segment performance measures (for our named executive officers that lead our business segments) and quantitative individual named executive officer performance.. Payout amounts are referred to in the following table as “ACI.”
Long-Term Incentive Awards —The Compensation Committee may approveestablishes long-term incentive awards for executive officers based on three-year cumulative performance measures as selected by the Committee. If the target measure is achieved, payout is of 100% of the target award. The award is in the form of performance share units which are settled in unrestricted Nordson common shares on a one-for-one basis. The payout will vary based upon the actual three-year performance. However, the three-year performance threshold must be achieved before any payout is made. These awards are referred to in the following table as “LTIC.“LTI.”
Restricted SharesShare Awards —Restricted shares are granted subject to restrictions on transferability. The shares may be voted but not sold or transferred during the restriction/vestingrestriction period. DividendsCash dividends are paid on the restricted shares during the restriction/vestingrestriction period. Restricted shares granted in 2011 vest on a pro-rata basis annually each year for three years. If an executive officer’s employment terminates due to death, disability, or early retirement afteryears following the grant date unvested shares are forfeited. If termination is due to retirement at or after normal retirement age (65), all restrictions lapse.of grant. These awards are referred to in the following table as “R.S.“RS.”
Stock OptionsOption Awards —Stock options have a term of ten years, become exercisable over a four-year period at the rate of 25% per year beginning one year from the grant date, and have an exercise price equal to the closing price of our common shares on the grant date. Each option permits the optioneegrantee to pay for the exercise price and satisfy tax-withholding obligations with previously owned common shares or with shares acquired upon exercise. Information with respect to each of these awards on a grant-by-grant basis is set forth in the table below. These awards are referred to in the following table as “Options.”
The impact of a termination of employment of an executive officer on these plan-based awards is discussed in the “Potential Benefits Upon Termination” section of this Proxy Statement.
5961
Grants of Plan-Based Awards During Fiscal Year 2011 Table
The following table and footnotes present the components of the plan-based grants made to our named executive officers during Fiscal Year 2011.2013.
| Estimated Future Payouts Under Non-equity Incentive Plan Awards (1) | Estimated Future Payouts Under Equity Incentive Plan Awards (2) | All Other Stock Awards: Number of Shares of Stock or Units | All Other Option Awards: Number of Securities Underlying Options | Exercise or Base Price of Option Awards | Grant Date Fair Value of Stock and Option Awards | Estimated Future Payouts Under Non-equity Incentive Plan Awards (1) | Estimated Future Payouts Under Equity Incentive Plan Awards (2) | All Other Stock Awards: Number of Shares of Stock or Units | All Other Option Awards: Number of Securities Underlying Options | Exercise or Base Price of Option Awards | Grant Date Fair Value of Stock and Option Awards (3) | |||||||||||||||||||||||||||||||||||||||||||||||||||||||||||||||||||||||||||||||||
| Threshold | Target | Maximum | Threshold | Target | Maximum | (3) | Threshold | Target | Maximum | Threshold | Target | Maximum | ||||||||||||||||||||||||||||||||||||||||||||||||||||||||||||||||||||||||||||||||
Name | Plan | Grant Date | $ | $ | $ | # | # | # | # | # | $/sh | $ | Plan | Grant Date | $ | $ | $ | # | # | # | # | # | $/sh | $ | ||||||||||||||||||||||||||||||||||||||||||||||||||||||||||||||||||||
Michael F. Hilton | ACI | Dec. 7, 2010 | 350,000 | 700,000 | 1,400,000 | — | — | — | — | — | — | — | ACI | Nov. 28, 2012 | 387,500 | 775,000 | 1,550,000 | — | — | — | — | — | — | — | ||||||||||||||||||||||||||||||||||||||||||||||||||||||||||||||||||||
| LTIC | Dec. 7, 2010 | — | — | — | 9,000 | 18,000 | 36,000 | — | — | — | 756,270 | LTI | Nov. 28, 2012 | — | — | — | 8,000 | 16,000 | 32,000 | — | — | — | 953,440 | |||||||||||||||||||||||||||||||||||||||||||||||||||||||||||||||||||||
| R.S. | Dec. 7, 2010 | — | — | — | — | — | — | 9,000 | — | — | 389,880 | RS | Nov. 28, 2012 | — | — | — | — | — | — | 8,000 | — | — | 492,720 | |||||||||||||||||||||||||||||||||||||||||||||||||||||||||||||||||||||
| Options | Dec. 7, 2010 | — | — | — | — | — | — | — | 50,000 | 43.32 | 859,250 | Options | Nov. 28, 2012 | — | — | — | — | — | — | — | 43,000 | 61.59 | 1,051,974 | |||||||||||||||||||||||||||||||||||||||||||||||||||||||||||||||||||||
Gregory A. Thaxton | ACI | Dec. 7, 2010 | 99,000 | 198,000 | 396,000 | — | — | — | — | — | — | — | ACI | Nov. 28, 2012 | 121,875 | 243,750 | 487,500 | — | — | — | — | — | — | — | ||||||||||||||||||||||||||||||||||||||||||||||||||||||||||||||||||||
| LTIC | Dec. 7, 2010 | — | — | — | 2,000 | 4,000 | 8,000 | — | — | — | 168,060 | LTI | Nov. 28, 2012 | — | — | — | 2,050 | 4,100 | 8,200 | — | — | — | 244,319 | |||||||||||||||||||||||||||||||||||||||||||||||||||||||||||||||||||||
| R.S. | Dec. 7, 2010 | — | — | — | — | — | — | 2,000 | — | — | 86,640 | RS | Nov. 28, 2012 | — | — | — | — | — | — | 2,000 | — | — | 123,180 | |||||||||||||||||||||||||||||||||||||||||||||||||||||||||||||||||||||
| Options | Dec. 7, 2010 | — | — | — | — | — | — | — | 11,400 | 43.32 | 195,909 | Options | Nov. 28, 2012 | — | — | — | — | — | — | — | 11,000 | 61.59 | 269,110 | |||||||||||||||||||||||||||||||||||||||||||||||||||||||||||||||||||||
John J. Keane | ACI | Dec. 7, 2010 | 115,500 | 231,000 | 462,000 | — | — | — | — | — | — | — | ACI | Nov. 28, 2012 | 128,450 | 256,900 | 513,800 | — | — | — | — | — | — | — | ||||||||||||||||||||||||||||||||||||||||||||||||||||||||||||||||||||
| LTIC | Dec. 7, 2010 | — | — | — | 2,800 | 5,600 | 11,200 | — | — | — | 235,284 | LTI | Nov. 28, 2012 | — | — | — | 2,200 | 4,400 | 8,800 | — | — | — | 262,196 | |||||||||||||||||||||||||||||||||||||||||||||||||||||||||||||||||||||
| R.S. | Dec. 7, 2010 | — | — | — | — | — | — | 2,800 | — | — | 121,296 | RS | Nov. 28, 2012 | — | — | — | — | — | — | 2,200 | — | — | 135,498 | |||||||||||||||||||||||||||||||||||||||||||||||||||||||||||||||||||||
| Options | Dec. 7, 2010 | — | — | — | — | — | — | — | 16,000 | 43.32 | 274,960 | Options | Nov. 28, 2012 | — | — | — | — | — | — | — | 11,900 | 61.59 | 291,128 | |||||||||||||||||||||||||||||||||||||||||||||||||||||||||||||||||||||
Peter G. Lambert | ACI | Dec. 7, 2010 | 85,500 | 171,000 | 342,000 | — | — | — | — | — | — | — | ACI | Nov. 28, 2012 | 96,000 | 192,000 | 384,000 | — | — | — | — | — | — | — | ||||||||||||||||||||||||||||||||||||||||||||||||||||||||||||||||||||
| LTIC | Dec. 7, 2010 | — | — | — | 1,900 | 3,800 | 7,600 | — | — | — | 159,657 | LTI | Nov. 28, 2012 | — | — | — | 1,550 | 3,100 | 6,200 | — | — | — | 184,729 | |||||||||||||||||||||||||||||||||||||||||||||||||||||||||||||||||||||
| R.S. | Dec. 7, 2010 | — | — | — | — | — | — | 1,800 | — | — | 77,976 | RS | Nov. 28, 2012 | — | — | — | — | — | — | 1,550 | — | — | 95,465 | |||||||||||||||||||||||||||||||||||||||||||||||||||||||||||||||||||||
| Options | Dec. 7, 2010 | — | — | — | — | — | — | — | 10,600 | 43.32 | 182,161 | Options | Nov. 28, 2012 | — | — | — | — | — | — | — | 8,500 | 61.59 | 207,948 | |||||||||||||||||||||||||||||||||||||||||||||||||||||||||||||||||||||
Douglas C. Bloomfield | ACI | Dec. 7, 2010 | 68,750 | 137,500 | 275,000 | — | — | — | — | — | — | — | ||||||||||||||||||||||||||||||||||||||||||||||||||||||||||||||||||||||||||||||||
Gregory P. Merk | ACI | Nov. 28, 2012 | 79,475 | 158,950 | 317,900 | — | — | — | — | — | — | — | ||||||||||||||||||||||||||||||||||||||||||||||||||||||||||||||||||||||||||||||||
| LTIC | Dec. 7, 2010 | — | — | — | 1,600 | 3,200 | 6,400 | — | — | — | 134,448 | LTI | Nov. 28, 2012 | — | — | — | 1,400 | 2,800 | 5,600 | — | — | — | 166,852 | |||||||||||||||||||||||||||||||||||||||||||||||||||||||||||||||||||||
| R.S. | Dec. 7, 2010 | — | — | — | — | — | — | 1,600 | — | — | 69,312 | RS | Nov. 28, 2012 | — | — | — | — | — | — | 1,450 | — | — | 89,306 | |||||||||||||||||||||||||||||||||||||||||||||||||||||||||||||||||||||
| Options | Dec. 7, 2010 | — | — | — | — | — | — | — | 9,400 | 43.32 | 161,539 | Options | Nov. 28, 2012 | — | — | — | — | — | — | — | 7,600 | 61.59 | 185,930 | |||||||||||||||||||||||||||||||||||||||||||||||||||||||||||||||||||||
| (1) | These columns show the estimated dollar value of the potential payout under the Annual Cash Incentive Plan at threshold, target or maximum payout |
| (2) | These columns show the potential number of shares to be paid out for our named executive officers under our Long-Term Incentive Plan at threshold, target or maximum performance. The measures and potential payouts are described in more detail in Part II of the Compensation Discussion and Analysis under the caption “Long Term Incentive Compensation.” The grant date fair value |
| (3) | Values in this column reflect the grant date fair value for stock option awards and performance share unit awards determined in accordance with FASB ASC Topic |
60
For establishing grant date fair value of stock options, we use the Black-Scholes option pricing model to calculate the fair value of stock options. The key assumptions for the Black-Scholes valuation method include the expected life of the option, stock price volatility, the risk-free interest rate, dividend yield and exercise price. The exercise price of stock options is the fair market value of our common shares on the date of grant. The following table sets forth the assumptions used in the calculation of the amounts for stock option awards presented in the table:
| For establishing grant date fair value of stock options, we use the Black-Scholes option pricing model to calculate the fair value of stock options. The key assumptions for the Black-Scholes valuation method include the expected life of the option, stock price volatility, the risk-free interest rate, dividend yield and exercise price. The exercise price of stock options is the fair market value of our common shares on the date of grant. The following table sets forth the assumptions used in the calculation of the amounts for stock option awards presented in the table: |
| a. | Expected Volatility: |
| b. | Risk-Free Interest Rate: The rate available at the time the grant was made on zero-coupon U.S. Government issues with a remaining term equal to the expected life: |
| c. | Dividend Yield: |
| d. | Expected Life: |
The calculations for the fair value of restricted stock are based upon the grant date fair value of restricted share awards determined using the market price of common stock at the grant date.
| The calculations for the fair value of restricted shares are based upon the grant date fair value of restricted share awards determined using the market price of common stock at the grant date. |
62
OUTSTANDING EQUITY AWARDS AT FISCAL 2011 YEAR-ENDOCTOBER 31, 2013
The following narrative, table and footnotes describe equity awards granted to our named executive officers under our Long-Term Performance Plan that were outstanding as of the end of Fiscal Year 2011:2013:
Fiscal Year 2010-20122012-2014 Long-Term Incentive Plan Performance Share Unit Awards (disclosed as “2010“2012 LTIP” awards in the “Stock Awards” columns). The Fiscal Year 2010-20122012-2014 performance period began on November 1, 20092011 and concludes on October 31, 2012.2014. Settlement of these awards will be in the form of unrestricted Nordson common shares on a one-for-one basis. The ultimate value of the awards will depend on the number of share units earned and the price of our common shares at the time of settlement.
Fiscal Year 2011-20132013-2015 Long-Term Incentive Plan Awards Performance Share UnitProgram Awards (disclosed as “2011“2013 LTIP” awards in the “Stock Awards” columns). The Fiscal Year 2011-20132013-2015 performance period began on November 1, 20102012 and concludes on October 31, 2013.2015. Settlement of these awards will be in the form of unrestricted Nordson common shares on a one-for-one basis. The ultimate value of the awards will depend on the number of share units earned and the price of our common shares at the time of settlement.
Restricted SharesShare Awards (disclosed in the “Stock Awards” columns). Consist of the unvested restricted share grants to named executive officers.
Stock OptionsOption Awards (disclosed in the “Option Awards” columns). Consist of outstanding stock option grants madeoptions granted to our named executive officers. Stock options have a term of ten years and become exercisable over a four year period at the rate of 25% per year, beginning one year from the grant date.
6163
Outstanding Equity Awards At Fiscal 2011 Year-End Table
The following table sets forth information with respect to performance share awards, restricted share awards and stock options held by our named executive officers as of October 31, 2011.2013. Dates noted below the names of the named executive officers represent grant dates for stock options and restricted shares.
| Option Awards | Stock Awards | |||||||||||||||||||||||||||||||
Name | Number of Securities Underlying Unexer- cised Options - Exercis- able (1) (#) | Number of Securities Underlying Unexer- cised Options- Unexercis- able (#) | Option Exercise Price $/sh | Option Expiration Date | Number of Shares or Units of Stock That Have Not Vested (#) | Market Value of Shares or Units of Stock That Have Not Vested (2) ($) | Equity Incentive Plan Awards: Number of Unearned Shares, Units or Other Rights Not Vested (3) (#) | Equity Incentive Plan Awards: Market or Payout Value of Unearned Shares, Units or Other Rights Not Vested ($) | ||||||||||||||||||||||||
Michael F. Hilton | ||||||||||||||||||||||||||||||||
2010 LTIP | — | — | — | — | — | — | 48,868 | 2,266,009 | ||||||||||||||||||||||||
2011 LTIP | — | — | — | — | — | — | 36,000 | 1,669,320 | ||||||||||||||||||||||||
Restricted Stock | ||||||||||||||||||||||||||||||||
16-Jan-10 (4) | — | — | — | — | 6,842 | 317,264 | — | — | ||||||||||||||||||||||||
7-Dec-10 (5) | — | — | — | — | 9,000 | 417,330 | — | — | ||||||||||||||||||||||||
Stock Options: | ||||||||||||||||||||||||||||||||
16-Jan-10 (6) | 17,304 | 51,914 | 30.70 | 16-Jan-2020 | — | — | — | — | ||||||||||||||||||||||||
7-Dec-10 (7) | — | 50,000 | 43.32 | 07-Dec-2020 | — | — | — | — | ||||||||||||||||||||||||
Gregory A. Thaxton | ||||||||||||||||||||||||||||||||
2010 LTIP | — | — | — | — | — | — | 12,000 | 556,440 | ||||||||||||||||||||||||
2011 LTIP | — | — | — | — | — | — | 8,000 | 370,960 | ||||||||||||||||||||||||
Restricted Shares | ||||||||||||||||||||||||||||||||
7-July-10 (8) | — | — | — | — | 2,934 | 136,050 | — | — | ||||||||||||||||||||||||
7-Dec-10 (5) | — | — | — | — | 2,000 | 92,740 | — | — | ||||||||||||||||||||||||
Stock Options: | ||||||||||||||||||||||||||||||||
5-Dec-07 (9) | 3,400 | 3,400 | 26.46 | 5-Dec-2017 | — | — | — | — | ||||||||||||||||||||||||
4-Dec-08 (10) | — | 13,100 | 14.37 | 4-Dec-2018 | — | — | — | — | ||||||||||||||||||||||||
3-Dec-09 (11) | — | 11,250 | 27.26 | 3-Dec-2019 | — | — | — | — | ||||||||||||||||||||||||
7-Dec-10 (7) | — | 11,400 | 43.32 | 7-Dec-2020 | — | — | — | — | ||||||||||||||||||||||||
John J. Keane | ||||||||||||||||||||||||||||||||
2010 LTIP | — | — | — | — | — | — | 16,000 | 741,920 | ||||||||||||||||||||||||
2011 LTIP | — | — | — | — | — | — | 11,200 | 519,344 | ||||||||||||||||||||||||
Restricted Shares | ||||||||||||||||||||||||||||||||
3-Dec-09 (12) | — | — | — | — | 4,000 | 185,480 | — | — | ||||||||||||||||||||||||
7-July-10 (8) | — | — | — | — | 2,000 | 92,740 | — | — | ||||||||||||||||||||||||
7-Dec-10 (5) | — | — | — | — | 2,800 | 129,836 | — | — | ||||||||||||||||||||||||
Stock Options: | ||||||||||||||||||||||||||||||||
5-Dec-07 (9) | — | 6,900 | 26.46 | 5-Dec-2017 | — | — | — | — | ||||||||||||||||||||||||
4-Dec-08 (10) | 22,700 | 22,700 | 14.37 | 4-Dec-2018 | — | — | — | — | ||||||||||||||||||||||||
3-Dec-09 (11) | 5,900 | 17,700 | 27.26 | 3-Dec-2019 | — | — | — | — | ||||||||||||||||||||||||
7-Dec-10 (7) | — | 16,000 | 43.32 | 7-Dec-2020 | — | — | — | — | ||||||||||||||||||||||||
Peter G. Lambert | ||||||||||||||||||||||||||||||||
2010 LTIP | — | — | — | — | — | — | 9,400 | 435,878 | ||||||||||||||||||||||||
2011 LTIP | — | — | — | — | — | — | 7,600 | 352,412 | ||||||||||||||||||||||||
Restricted Shares | ||||||||||||||||||||||||||||||||
7-July-10 (8) | — | — | — | — | 2,668 | 123,715 | — | — | ||||||||||||||||||||||||
7-Dec-10 (5) | — | — | — | — | 1,800 | 83,466 | — | — | ||||||||||||||||||||||||
Stock Options: | ||||||||||||||||||||||||||||||||
5-Dec-07 (9) | — | 3,400 | 26.46 | 5-Dec-2017 | — | — | — | — | ||||||||||||||||||||||||
4-Dec-08 (10) | — | 11,400 | 14.37 | 4-Dec-2018 | — | — | — | — | ||||||||||||||||||||||||
3-Dec-09 (11) | — | 9,900 | 27.26 | 3-Dec-2019 | — | — | — | — | ||||||||||||||||||||||||
7-Dec-10 (7) | — | 10,600 | 43.32 | 7-Dec-2020 | — | — | — | — | ||||||||||||||||||||||||
| Option Awards | Stock Awards | |||||||||||||||||||||||||||||||
Name | Number of Securities Underlying Unexer- cised Options - Exercis- able (1) (#) | Number of Securities Underlying Unexer- cised Options- Unexercis- able (1) (#) | Option Exercise Price $/sh | Option Expiration Date | Number of Shares or Units of Stock That Have Not Vested (2) (#) | Market Value of Shares or Units of Stock That Have Not Vested (2) ($) | Equity Incentive Plan Awards: Number of Unearned Shares, Units or Other Rights Not Vested (3) (#) | Equity Incentive Plan Awards: Market or Payout Value of Unearned Shares, Units or Other Rights Not Vested (4) ($) | ||||||||||||||||||||||||
Michael F. Hilton | ||||||||||||||||||||||||||||||||
2012 LTIP | — | — | — | — | — | — | 40,000 | 2,883,600 | ||||||||||||||||||||||||
2013 LTIP | — | — | — | — | — | — | 32,000 | 2,306,880 | ||||||||||||||||||||||||
Restricted Shares | ||||||||||||||||||||||||||||||||
7-Dec-2010 | — | — | — | — | 3,000 | 216,270 | — | — | ||||||||||||||||||||||||
28-Nov-2011 | — | — | — | — | 6,667 | 480,624 | — | — | ||||||||||||||||||||||||
28-Nov-2012 | — | — | — | — | 8,000 | 576,720 | — | — | ||||||||||||||||||||||||
Stock Options: | ||||||||||||||||||||||||||||||||
16-Jan-2010 (5) | 51,913 | 17,305 | 30.70 | 16-Jan-2020 | — | — | — | — | ||||||||||||||||||||||||
7-Dec-2010 | 25,000 | 25,000 | 43.32 | 07-Dec-2020 | — | — | — | — | ||||||||||||||||||||||||
28-Nov-2011 | 13,750 | 41,250 | 43.73 | 28-Nov-2021 | — | — | — | — | ||||||||||||||||||||||||
28-Nov-2012 | — | 43,000 | 61.59 | 28-Nov-2022 | — | — | — | — | ||||||||||||||||||||||||
Gregory A. Thaxton | ||||||||||||||||||||||||||||||||
2012 LTIP | — | — | — | — | — | — | 9,000 | 648,810 | ||||||||||||||||||||||||
2013 LTIP | — | — | — | — | — | — | 8,200 | 591,138 | ||||||||||||||||||||||||
Restricted Shares | ||||||||||||||||||||||||||||||||
7-Dec-2010 | — | — | — | — | 668 | 48,156 | — | — | ||||||||||||||||||||||||
28-Nov-2011 | — | — | — | — | 1,534 | 110,586 | — | — | ||||||||||||||||||||||||
28-Nov-2012 | — | — | — | — | 2,000 | 144,180 | — | — | ||||||||||||||||||||||||
Stock Options: | ||||||||||||||||||||||||||||||||
5-Dec-2007 | 4,800 | — | 26.46 | 5-Dec-2017 | — | — | — | — | ||||||||||||||||||||||||
4-Dec-2008 | 13,100 | — | 14.37 | 4-Dec-2018 | — | — | — | — | ||||||||||||||||||||||||
3-Dec-2009 | 7,500 | 3,750 | 27.26 | 3-Dec-2019 | — | — | — | — | ||||||||||||||||||||||||
7-Dec-2010 | 5,700 | 5,700 | 43.32 | 7-Dec-2020 | — | — | — | — | ||||||||||||||||||||||||
28-Nov-2011 | 3,250 | 9,750 | 43.73 | 28-Nov-2021 | — | — | — | — | ||||||||||||||||||||||||
28-Nov-2012 | — | 11,000 | 61.59 | 28-Nov-2022 | — | — | — | — | ||||||||||||||||||||||||
John J. Keane | ||||||||||||||||||||||||||||||||
2012 LTIP | — | — | — | — | — | — | 12,000 | 865,080 | ||||||||||||||||||||||||
2013 LTIP | — | — | — | — | — | — | 8,800 | 634,392 | ||||||||||||||||||||||||
Restricted Shares | ||||||||||||||||||||||||||||||||
7-Dec-2010 | — | — | — | — | 936 | 67,476 | — | — | ||||||||||||||||||||||||
28-Nov-2011 | — | — | — | — | 2,000 | 144,180 | — | — | ||||||||||||||||||||||||
28-Nov-2012 | — | — | — | — | 2,200 | 158,598 | — | — | ||||||||||||||||||||||||
Stock Options: | ||||||||||||||||||||||||||||||||
5-Dec-2007 | 6,900 | — | 26.46 | 5-Dec-2017 | — | — | — | — | ||||||||||||||||||||||||
4-Dec-2008 | 45,400 | — | 14.37 | 4-Dec-2018 | — | — | — | — | ||||||||||||||||||||||||
3-Dec-2009 | 17,700 | 5,900 | 27.26 | 3-Dec-2019 | — | — | — | — | ||||||||||||||||||||||||
7-Dec-2010 | 8,000 | 8,000 | 43.32 | 7-Dec-2020 | — | — | — | — | ||||||||||||||||||||||||
28-Nov-2011 | 4,000 | 12,000 | 43.73 | 28-Nov-2021 | — | — | — | — | ||||||||||||||||||||||||
28-Nov-2012 | — | 11,900 | 61.59 | 28-Nov-2022 | — | — | — | — | ||||||||||||||||||||||||
6264
| Option Awards | Stock Awards | |||||||||||||||||||||||||||||||
Name | Number of Securities Underlying Unexer- cised Options - Exercis- able (1) (#) | Number of Securities Underlying Unexer- cised Options- Unexercis- able (#) | Option Exercise Price $/sh | Option Expiration Date | Number of Shares or Units of Stock That Have Not Vested (#) | Market Value of Shares or Units of Stock That Have Not Vested (2) ($) | Equity Incentive Plan Awards: Number of Unearned Shares, Units or Other Rights Not Vested (3) (#) | Equity Incentive Plan Awards: Market or Payout Value of Unearned Shares, Units or Other Rights Not Vested ($) | ||||||||||||||||||||||||
Douglas C. Bloomfield | ||||||||||||||||||||||||||||||||
2010 LTIP | — | — | — | — | — | — | 8,400 | 389,508 | ||||||||||||||||||||||||
2011 LTIP | — | — | — | — | — | — | 6,400 | 296,768 | ||||||||||||||||||||||||
Restricted Shares | ||||||||||||||||||||||||||||||||
7-July-10 (8) | — | — | — | — | 2,400 | 111,288 | — | — | ||||||||||||||||||||||||
7-Dec-10 (5) | — | — | — | — | 1,600 | 74,192 | — | — | ||||||||||||||||||||||||
Stock Options: | ||||||||||||||||||||||||||||||||
5-Dec-07 (9) | 10,200 | 3,400 | 26.46 | 5-Dec-2017 | — | — | — | — | ||||||||||||||||||||||||
4-Dec-08 (10) | 11,400 | 11,400 | 14.37 | 4-Dec-2018 | — | — | — | — | ||||||||||||||||||||||||
3-Dec-09 (11) | 3,050 | 9,150 | 27.26 | 3-Dec-2019 | — | — | — | — | ||||||||||||||||||||||||
7-Dec-10 (7) | — | 9,400 | 43.32 | 7-Dec-2020 | — | — | — | — | ||||||||||||||||||||||||
| Option Awards | Stock Awards | |||||||||||||||||||||||||||||||
Name | Number of Securities Underlying Unexer- cised Options - Exercis- able (1) (#) | Number of Securities Underlying Unexer- cised Options- Unexercis- able (1) (#) | Option Exercise Price $/sh | Option Expiration Date | Number of Shares or Units of Stock That Have Not Vested (2) (#) | Market Value of Shares or Units of Stock That Have Not Vested (2) ($) | Equity Incentive Plan Awards: Number of Unearned Shares, Units or Other Rights Not Vested (3) (#) | Equity Incentive Plan Awards: Market or Payout Value of Unearned Shares, Units or Other Rights Not Vested (4) ($) | ||||||||||||||||||||||||
Peter G. Lambert | ||||||||||||||||||||||||||||||||
2012 LTIP | — | — | — | — | — | — | 7,800 | 562,302 | ||||||||||||||||||||||||
2013 LTIP | — | — | — | — | — | — | 6,200 | 446,958 | ||||||||||||||||||||||||
Restricted Shares | ||||||||||||||||||||||||||||||||
7-Dec-2010 | — | — | — | — | 600 | 43,254 | — | — | ||||||||||||||||||||||||
28-Nov-2011 | — | — | — | — | 1,334 | 96,168 | — | — | ||||||||||||||||||||||||
28-Nov-2012 | — | — | — | — | 1,550 | 111,740 | — | — | ||||||||||||||||||||||||
Stock Options: | ||||||||||||||||||||||||||||||||
5-Dec-2007 | 3,400 | — | 26.46 | 5-Dec-2017 | — | — | — | — | ||||||||||||||||||||||||
4-Dec-2008 | 11,400 | — | 14.37 | 4-Dec-2018 | — | — | — | — | ||||||||||||||||||||||||
3-Dec-2009 | 6,600 | 3,300 | 27.26 | 3-Dec-2019 | — | — | — | — | ||||||||||||||||||||||||
7-Dec-2010 | 5,300 | 5,300 | 43.32 | 7-Dec-2020 | — | — | — | — | ||||||||||||||||||||||||
28-Nov-2011 | 2,625 | 7,875 | 43.73 | 28-Nov-2021 | — | — | — | — | ||||||||||||||||||||||||
28-Nov-2012 | — | 8,500 | 61.59 | 28-Nov-2022 | — | — | — | — | ||||||||||||||||||||||||
Gregory P. Merk | ||||||||||||||||||||||||||||||||
2012 LTIP | — | — | — | — | — | — | 7,000 | 504,630 | ||||||||||||||||||||||||
2013 LTIP | — | — | — | — | — | — | 5,600 | 403,704 | ||||||||||||||||||||||||
Restricted Shares | ||||||||||||||||||||||||||||||||
7-Dec-2010 | — | — | — | — | 536 | 38,640 | — | — | ||||||||||||||||||||||||
28-Nov-2011 | — | — | — | — | 1,200 | 86,508 | — | — | ||||||||||||||||||||||||
28-Nov-2012 | — | — | — | — | 1,450 | 104,531 | — | — | ||||||||||||||||||||||||
Stock Options: | ||||||||||||||||||||||||||||||||
9-Dec-2004 | 3,600 | — | 18.46 | 9-Dec-2014 | — | — | — | — | ||||||||||||||||||||||||
7-Dec-2005 | 2,400 | — | 19.25 | 7-Dec-2015 | — | — | — | — | ||||||||||||||||||||||||
22-Nov-2006 | 15,600 | — | 24.39 | 22-Nov-2016 | — | — | — | — | ||||||||||||||||||||||||
5-Dec-2007 | 13,600 | — | 26.46 | 5-Dec-2017 | — | — | — | — | ||||||||||||||||||||||||
4-Dec-2008 | 22,800 | — | 14.37 | 4-Dec-2018 | — | — | — | — | ||||||||||||||||||||||||
3-Dec-2009 | 9,150 | 3,050 | 27.26 | 3-Dec-2019 | — | — | — | — | ||||||||||||||||||||||||
7-Dec-2010 | 4,500 | 4,500 | 43.32 | 7-Dec-2020 | — | — | — | — | ||||||||||||||||||||||||
28-Nov-2011 | 2,500 | 7,500 | 43.73 | 28-Nov-2021 | — | — | — | — | ||||||||||||||||||||||||
28-Nov-2012 | — | 7,600 | 61.59 | 28-Nov-2022 | — | — | — | — | ||||||||||||||||||||||||
| (1) |
| (2) | Amounts in these columns represent restricted share grants that have not vested as of October 31, 2013. Restricted shares vest in three equal annual installments, commencing one year after grant date. Market |
| (3) | This column reflects performance shares granted in |
| (4) | The |
| (5) |
| Upon his employment as President and Chief Executive Officer, Mr. Hilton was granted 69,218 stock options pursuant to the employment agreement we entered into with Mr. Hilton. These options are exercisable in four equal installments (25% of grant per year), commencing January 16, 2011. |
6365
OPTION EXERCISES AND STOCK VESTED DURING FISCAL YEAR 2011TABLES
The following table setstables set forth information with respect to the stock options exercised, restricted shares vested and restricted stock vestedperformance share unit awards during Fiscal Year 2011,2013, before payment of any applicable withholding tax and broker commissions.
| Option Awards | Stock Awards | |||||||||||||||
Named Executive Officer | Acquired on Exercise (#) | Value Realized on Exercise (1) ($) | Number of Shares Acquired on Vesting (#) | Value Realized on Vesting ($) (2) | ||||||||||||
Michael F. Hilton | — | — | — | — | ||||||||||||
Gregory A. Thaxton | 14,670 | 390,652 | 1,466 | 86,509 | ||||||||||||
John J. Keane | 52,700 | 1,171,669 | 1,000 | 59,010 | ||||||||||||
Peter G. Lambert | 56,500 | 1,750,493 | 1,332 | 78,601 | ||||||||||||
Douglas C. Bloomfield | 24,600 | 581,034 | 1,200 | 70,812 | ||||||||||||
| Option Awards | 2011-2013 LTIP Payout | |||||||||||||||
Named Executive Officer | Number of Shares Acquired on Exercise (#) | Value Realized on Exercise ($) | Number of Shares Acquired on Vesting (#) | Value Realized on Vesting ($) (1) | ||||||||||||
Michael F. Hilton | — | — | 36,000 | 2,655,720 | ||||||||||||
Gregory A. Thaxton | 2,000 | 87,490 | 8,000 | 590,160 | ||||||||||||
John J. Keane | — | — | 11,200 | 826,224 | ||||||||||||
Peter G. Lambert | — | — | 7,600 | 560,652 | ||||||||||||
Gregory P. Merk | 3,600 | 185,416 | 6,400 | 472,128 | ||||||||||||
| (1) | Settlement of vested share unit payouts occurred on January 3, 2014. The closing price of our common shares was $73.77 on January 3, 2014. Mr. Hilton deferred 32,400 units having a settlement date value of $2,390,148 and Mr. Merk deferred 640 units having a settlement date value of $47,213 under the 2005 Deferred Compensation Plan. |
| Stock Awards (1) | ||||||||||||||||||||||||||||||||||||||||
| Restricted shares (Vested 11/28/12) | Restricted shares (Vested 12/3/12) | Restricted shares (Vested 12/7/12) | Restricted shares (Vested 1/16/13) | Restricted shares (Vested 7/7/13) | ||||||||||||||||||||||||||||||||||||
Named Executive | Number of Shares Acquired on Vesting (#) | Value Realized on Vesting ($) | Number of Shares Acquired on Vesting (#) | Value Realized on Vesting ($) | Number of Shares Acquired on Vesting (#) | Value Realized on Vesting ($) | Number of Shares Acquired on Vesting (#) | Value Realized on Vesting ($) | Number of Shares Acquired on Vesting (#) | Value Realized on Vesting ($) | ||||||||||||||||||||||||||||||
Michael F. Hilton | 3,333 | 205,279 | — | — | 3,000 | 189,840 | 6,842 | 449,040 | — | — | ||||||||||||||||||||||||||||||
Gregory A. Thaxton | 766 | 47,178 | — | — | 666 | 42,144 | — | — | 1,468 | 104,052 | ||||||||||||||||||||||||||||||
John J. Keane | 1,000 | 61,590 | 4,000 | 246,040 | 932 | 58,977 | — | — | 1,000 | 70,880 | ||||||||||||||||||||||||||||||
Peter G. Lambert | 666 | 41,019 | — | — | 600 | 37,968 | — | — | 1,336 | 94,696 | ||||||||||||||||||||||||||||||
Gregory P. Merk | 600 | 36,954 | — | — | 532 | 33,665 | — | — | 1,200 | 85,056 | ||||||||||||||||||||||||||||||
| (1) | Value |
Named Executive Officer | Grant Date Price ($) | Date of Exercise | Number of Shares Acquired Upon Exercise | Share Price ($) at Time of Acquisition | ||||||||||||
Michael F. Hilton | — | — | — | — | ||||||||||||
Gregory A. Thaxton | $ | 19.25 | Jan. 13, 2011 | 720 | $ | 47.19 | ||||||||||
| $ | 24.39 | Jan. 13, 2011 | 3,650 | $ | 47.05 | |||||||||||
| $ | 27.26 | Jan. 13, 2011 | 3,750 | $ | 47.02 | |||||||||||
| $ | 14.37 | Jan. 13, 2011 | 6,550 | $ | 47.00 | |||||||||||
John J. Keane | $ | 26.46 | Jan. 3, 2011 | 9,360 | $ | 47.61 | ||||||||||
| $ | 24.39 | Jan. 3, 2011 | 8,000 | $ | 47.59 | |||||||||||
| $ | 24.39 | Jan. 3, 2011 | 8,000 | $ | 47.48 | |||||||||||
| $ | 24.39 | Jan. 3, 2011 | 4,000 | $ | 47.51 | |||||||||||
| $ | 24.39 | Jan. 3, 2011 | 6,000 | $ | 47.43 | |||||||||||
| $ | 24.39 | Jan. 3, 2011 | 6,000 | $ | 47.34 | |||||||||||
| $ | 26.46 | Jan. 3, 2011 | 11,340 | $ | 47.18 | |||||||||||
Peter G. Lambert | $ | 14.37 | Mar. 3, 2011 | 11,400 | $ | 55.00 | ||||||||||
| $ | 27.26 | Mar. 3, 2011 | 3,300 | $ | 55.00 | |||||||||||
| $ | 24.39 | Mar. 3, 2011 | 15,600 | $ | 55.00 | |||||||||||
| $ | 26.46 | Mar. 3, 2011 | 9,030 | $ | 55.00 | |||||||||||
| $ | 26.46 | Jan. 12, 2011 | 1,170 | $ | 47.50 | |||||||||||
| $ | 19.50 | Dec. 23, 2010 | 4,000 | $ | 46.81 | |||||||||||
| $ | 19.50 | Dec. 23, 2010 | 4,000 | $ | 46.73 | |||||||||||
| $ | 19.50 | Dec. 23, 2010 | 4,000 | $ | 46.75 | |||||||||||
| $ | 19.50 | Dec. 23, 2010 | 4,000 | $ | 46.69 | |||||||||||
Douglas C. Bloomfield | $ | 19.50 | Dec. 20, 2010 | 9,000 | $ | 46.19 | ||||||||||
| $ | 24.39 | Dec. 20, 2010 | 15,600 | $ | 46.18 | |||||||||||
November 28, 2012 ($61.59 per share);
December 3, 2012 ($61.51 per share);
December 7, 2012 ($63.28 per share);
January 16, 2013 ($65.63 per share);
July 7, 2013 ($70.88 per share).
6466
PENSION BENEFITS FOR FISCAL YEAR 2011TABLE
The following table, narrative and footnotes set forth the actuarial present value of, and other information about, the pension benefits accumulated by each of our named executive officers for Fiscal Year 2011.2013.
Named Executive Officer | Plan Name | Number of Years Credited Service # | Present Value of Accumulated Benefit (1)(2) $ | Payments During Last Fiscal Year $ | Plan Name | Number of Years Credited Service # | Present Value of Accumulated Benefit (1)(2) $ | Payments During Last Fiscal Year $ | ||||||||||||||||||||
Michael F. Hilton | Salaried Employees Pension Plan | — | — | — | Salaried Employees Pension Plan | — | — | — | ||||||||||||||||||||
| Excess Defined Benefit Pension Plan (3) | 1.75 | 441,856 | — | Excess Defined Benefit Pension Plan (3) | 3.75 | 1,261,490 | — | |||||||||||||||||||||
Gregory A. Thaxton | Salaried Employees Pension Plan | 22.0 | 568,438 | — | Salaried Employees Pension Plan | 24.0 | 677,190 | — | ||||||||||||||||||||
| Excess Defined Benefit Pension Plan | 22.0 | 595,147 | — | Excess Defined Benefit Pension Plan | 24.0 | 1,187,833 | — | |||||||||||||||||||||
John J. Keane | Salaried Employees Pension Plan | 19.0 | 492,755 | — | Salaried Employees Pension Plan | 21.0 | 594,826 | — | ||||||||||||||||||||
| Excess Defined Benefit Pension Plan | 19.0 | 1,086,060 | — | Excess Defined Benefit Pension Plan | 21.0 | 1,410,823 | — | |||||||||||||||||||||
Peter G. Lambert | Salaried Employees Pension Plan | 18.5 | 490,837 | — | Salaried Employees Pension Plan | 20.5 | 595,148 | — | ||||||||||||||||||||
| Excess Defined Benefit Pension Plan | 18.5 | 544,000 | — | Excess Defined Benefit Pension Plan | 20.5 | 825,162 | — | |||||||||||||||||||||
Douglas C. Bloomfield | Salaried Employees Pension Plan | 24.0 | 650,038 | — | ||||||||||||||||||||||||
Gregory P. Merk (4) | Salaried Employees Pension Plan | 0.75 | 16,680 | — | ||||||||||||||||||||||||
| Excess Defined Benefit Pension Plan | 24.0 | 634,305 | — | Excess Defined Benefit Pension Plan | 19.33 | 459,983 | — | |||||||||||||||||||||
| (1) | For the Salaried Employees Pension Plan, the actuarial assumptions used to determine the present value of the accumulated benefit at October 31, |
measurement date of October 31;
each participant’s benefit commences at age 65, the age at which retirement may occur without any age-based reduction in benefits, discounted to October 31, 20112013 using a discount rate of 4.25%4.40%;
the benefits are payable as a single life annuity; and
post-retirement mortality based on the RP2000 Unisex2013 Plan Year IRC 430 Non-annuitant Mortality Table updatedProjected to reflect the projection of an additional year of mortality improvements.2028.
| (2) | For the Excess Defined Benefit Pension Plan, the calculation of the present value of the accumulated benefit assumes that each participant’s benefit is payable as a lump sum commencing at age 65, the age at which retirement may occur without any age-based reduction in benefits, discounted to October 31, |
| (3) | Under the terms of his employment agreement, Mr. Hilton has an individual non-qualified supplemental pension benefit that treats Mr. Hilton as if he were fully vested in the Salaried Employees Pension Plan, solely in the event that Mr. Hilton experiences a termination due to death, disability, or without cause, or resignation with good reason (whether or not in connection with a change-in-control), as those terms are defined in the employment agreement, prior to becoming one hundred percent (100%) vested in the Salaried Employees Pension Plan. This benefit would be paid under the non-qualified Excess Defined Benefit Pension Plan. Once Mr. Hilton has accrued sufficient service to be fully vested in the Salaried Employees Pension Plan, we will have no obligation to provide |
| (4) | Mr. Merk became a participant in the Salaried Employees Pension Plan and the Excess Defined Benefit Pension Plan effective February 1, 2013. He receives benefit service credit for his past service with Nordson under the Excess Defined Benefit Pension Plan. |
Salaried Employees Pension Plan
We sponsor the Nordson Corporation Salaried Employees Pension Plan (the “Salaried Employees Pension Plan”), a pension plan for our U.S.-based salaried employees, including our U.S.-based named executive officers. Benefits under the pension plan are based on a “final average pay,” which means the monthly average of the highest aggregate compensation (base salary and annual cash incentive payment) for 60 months of the 120 most recent consecutive months prior to retirement. Compensation used to determine benefits under the Salaried Employees Pension Plan may not exceed the limit under the Internal Revenue Code.
Normal retirement age under the Salaried Employees Pension Plan is age 65. Employees who retire on or after age 55 may begin receiving their benefit immediately but experience a reduction in the
6567
benefit for every year prior to age 65 that the benefit begins. Employees become 100% vested in their benefit at the earlier of age 55, or after five years of service. The benefits are further reduced by benefits received under the Social Security program.
If the employee dies prior to receiving the vested benefit, the surviving spouse, if any, will receive a 50% survivor annuity for the rest of the surviving spouse’s life. Benefits under the Salaried Employees Pension Plan become payable on the first of the month following retirement, absent any election by a participant to commence the payment of benefits at a different time. Benefits are payable in one of the following ways:
Life Only Annuity. If a participant is not married or has been married less than 12 months when payments begin and does not elect an optional payment method, he or she will receive the full amount of his or her benefit in equal monthly installments for the rest of his or her life. Payments begin on the first of the month following the retirement date. After death, no additional payments are made.
50% Joint & Survivor Annuity. If a participant is married for at least 12 months when payments begin, he or she will receive his or her benefit as a 50% Joint & Survivor Annuity, absent election of (and spousal consent for) an optional payment form. Under this option, a participant will receive a reduced monthly benefit during his or her lifetime. After the participant’s death, his or her spouse receives a benefit equal to 50% of the monthly benefit the participant was receiving. If the spouse dies before the participant, but after the participant begins receiving payments, the participant will continue to receive the same benefit amount during his or her lifetime and no additional payments are made after death.
100% (or 75%) Joint & Survivor Annuity. A participant will receive a reduced lifetime benefit under this option. The participant names a beneficiary and chooses the percentage of his or her benefit to continue to that individual after the participant’s death. After death, the beneficiary receives the percentage of benefit elected (100% or 75%) for the remainder of his or her life. The participant’s age at the date the benefit commences, the beneficiary’s age and the percentage elected to continue after death affect the amount of the benefit received during the participant’s lifetime.
10 Year Certain Annuity. A participant will receive a reduced lifetime benefit in equal monthly installments with payments guaranteed for at least ten years under this option. Payments continue for the rest of the participant’s life even if he or she lives longer than the period of time elected. However, if the participant receives less than 120 payments before death, the same monthly benefit continues to the beneficiary until the combined total number of installment payments are made.
Level Income Option. This option allows a participant to receive an increased monthly payment from the pension plan initially if a participant retires early and begins receiving payments from the pension plan before he or she is eligible for Social Security benefits. After Social Security benefits begin, the monthly payment from the pension plan is reduced. This option does not provide any survivor benefit and, therefore, no benefit is payable after death.
Excess Defined Benefit Pension Plan
We also sponsor an Excess Defined Benefit Pension Plan for our U.S.-based executive officers. This plan is a non-tax qualified supplemental plan designed to work in conjunction with the Salaried Employees Pension Plan. The pension benefit outlined above for the Salaried Employees Pension Plan is calculated as if there were no compensation limits under the Internal Revenue Code. Then, the maximum benefit allowable is paid out under the Salaried Employees Pension Plan and the balance is paid out under the Excess Defined Benefit Pension Plan. In addition to the benefit payout alternatives listed above, under the Excess Defined Benefit Pension Plan, our executive officers may elect a lump sum payout of the benefit following termination of employment.
6668
Benefits under the Excess Defined Benefit Pension Plan are unsecured and are payable from our general assets. Payments will be delayed if and to the extent payment within six months of the termination of employment will result in the imposition of additional taxes on the executive officer pursuant to Section 409A of the Internal Revenue Code. Payments delayed due to Section 409A rules will accrue interest during the deferral period at the 10-year Treasury bill rate in effect on the first business day of the Excess Defined Benefit Pension Plan year in which the delayed payment period commences.
NON-QUALIFIED DEFERRED COMPENSATION FOR FISCAL YEAR 2011
The following table sets forth the contributions, earnings, withdrawals or distributions and aggregate balances for the named executive officers participating in our deferred compensation plans for Fiscal Year 2011.2013.
| 2005 Deferred Compensation Plan | 2005 Deferred Compensation Plan | |||||||||||||||||||||||||||||||||||||||
Named Executive Officer | Executive Contributions in Last Fiscal Year (1) ($) | Registrant Contributions in Last Fiscal Year ($) | Aggregate Earnings in Last Fiscal Year ($) | Aggregate With- drawals / Distributions ($) | Aggregate Balance at Last Fiscal Year End ($) | Executive Contributions in Last Fiscal Year (1) ($) | Registrant Contributions in Last Fiscal Year ($) | Aggregate Earnings in Last Fiscal Year ($) | Aggregate With- drawals / Distributions ($) | Aggregate Balance at Last Fiscal Year End ($) | ||||||||||||||||||||||||||||||
Michael F. Hilton | 98,636 | 11,847 | 3,325 | — | 140,097 | 2,989,066 | 56,463 | 324,034 | — | 3,687,790 | ||||||||||||||||||||||||||||||
Gregory A. Thaxton | 113,290 | 1,992 | 94,669 | — | 374,533 | 745,082 | 14,858 | 309,320 | — | 2,082,389 | ||||||||||||||||||||||||||||||
John J. Keane | 22,539 | 2,245 | 107,768 | — | 1,133,122 | 30,000 | 16,000 | 287,224 | — | 1,708,032 | ||||||||||||||||||||||||||||||
Peter G. Lambert | — | — | 1,793 | — | 36,176 | 22,384 | 11,332 | 21,274 | — | 115,528 | ||||||||||||||||||||||||||||||
Douglas C. Bloomfield | 266,664 | 312 | 166,888 | — | 1,126,267 | |||||||||||||||||||||||||||||||||||
Gregory P. Merk | 21,505 | — | 3,131 | — | 24,637 | |||||||||||||||||||||||||||||||||||
| (1) | This column |
| (a) | amounts of base salary each named executive officer deferred in |
| (b) | amount of annual cash incentive compensation Mr. Hilton deferred was $60,965. |
| (c) | For the 2011-2013 long-term performance payout, Mr. Hilton deferred 32,400 units having a settlement date value of $2,390,148 and Mr. Merk deferred 640 units having a settlement date value of $47,213. |
Deferred Compensation Plan
Under the 2005 Deferred Compensation Plan, our executive officers may elect to defer up to 100% of their base pay and annual cash incentive compensation and 90% of their long-term incentive plan payout each year. An executive officer may elect to invest in a number of investment accounts designated by the Compensation Committee, including an account comprised of units of our common shares. The cash investment accounts mirror the investment funds and investment returns provided under our qualified defined contribution 401(k) plan, although the plans are not linked. The number of units credited to the share unit account is based on the closing price of our common shares on the day the share units are credited to the account and includes additional share units credited for quarterly dividends paid on our common shares.
Distributions are made in either a lump sum or installments based upon the executive officer’s annual election. An executive officer may elect to receive payment in the form of a single lump sum or periodic payments over a period of 5, 10 or 15 years. At leastNo later than 12 months prior to a distribution, an executive officer may make an election to change the payment date or form of payment, provided that the distribution occurs at least 5 years after the original date of distribution.distribution previously elected by the executive officer.
The Internal Revenue Service places limits on amounts that “highly compensated employees,” such as our executive officers, may contribute to 401(k) plans. Correspondingly, because of these limits, matching contributions to the 401(k) plan accounts of our executive officers in Fiscal Year 20112013 were limited. In
69
order to restore any matching contribution amount that may have been forgone by our executive officers because of this limitation, we provide executive officers the opportunity to capture this potentially lost match in the deferred compensation plan. This restoration match is made to the executive officers who defer all orat least a minimum portion of their base salary.
67
The primary benefit to our executive officers who participate in the deferred compensation plans is that most taxes are deferred on deferred amounts until the executive officer’s account balance is distributed, so savings accumulate on a pre-tax basis.
The Compensation Committee may accelerate the distribution of part or all of one or more ofUpon an executive officer’s deferred account for reasons of a severe financial hardship that cannot be met using other financial resources. If an executive officer dies,death, payment will be made to an executive officer’sa designated beneficiary. For all distributions, cash will be paid with respect to the cash accounts and our common shares will be issued equal to the number of share units in the executive officer’s share equivalent unit account.
In order to permit deferrals and payouts that comply with Section 409A of the Internal Revenue Code, we adopted the 2005 Deferred Compensation Plan effective for deferrals by the executive officers after January 1, 2005. On December 10, 2008, the Compensation Committee adopted the Amended and Restated 2005 Deferred Compensation Plan to bring the plan into compliance with final rules issued under Section 409A.
The investment options under the 2005 Deferred Compensation Plan for 2011, 2012 and 2013 were identical for Fiscal Years 2009, 2010 and 2011. There were seven investment funds that a named executive officer could choose in Fiscal Year 2011 with annual rates of return for the year ended October 31, 2011 ranging from -4.82% to 19.98%.as follows:
Investment Funds | 2009 Return % | 2010 Return % | 2011 Return % | 2011 Return % | 2012 Return % | 2013 Return % | ||||||||||||||||||
Investment Contract | 3.58 | % | 3.50 | % | 3.29 | % | 3.29 | % | 2.72 | % | 3.00 | % | ||||||||||||
Money Market (B) | 0.08 | % | 0.04 | % | 0.08 | % | 0.08 | % | 0.03 | % | (0.59 | %) | ||||||||||||
Large Cap Value (500 Index B) | 8.59 | % | 9.69 | % | 7.62 | % | 7.62 | % | 15.89 | % | 26.11 | % | ||||||||||||
Large Cap Blend (Equity-Income) | 9.06 | % | 8.29 | % | 5.57 | % | 5.57 | % | 17.52 | % | 26.61 | % | ||||||||||||
Large Cap Growth (Blue Chip Growth) | 20.16 | % | 15.05 | % | 6.88 | % | 6.88 | % | 17.20 | % | 35.49 | % | ||||||||||||
International Equity Index (B) | 30.35 | % | 4.77 | % | -4.82 | % | -4.82 | % | 10.17 | % | 19.34 | % | ||||||||||||
Nordson Stock (includes dividends) | 45.98 | % | 49.65 | % | 19.98 | % | 19.98 | % | 49.43 | % | 23.19 | % | ||||||||||||
70
POTENTIAL PAYMENTSBENEFITS UPON TERMINATION
The following narrativetables and tablesnarrative reflect the impact a loss of employment in each of the following scenarios has on executive compensation and benefits: termination for cause or voluntary separation, death, long-term disability, retirement, termination without cause or for good reason and payments in connection with a termination following a change-in-control.
Payments Made Upon All Terminations
Our executive officers would receive the following payments upon a termination of employment due to death, disability, retirement, termination without cause or for good reason:
base salary earned but not yet paid as of the date of termination;
Annual Cash Incentive Plan payout earned but not yet paid as of the date of termination; and
Long-Term Incentive Plan payouts for the most recently completed three-year performance period not yet paid as of the date of termination.
Payout of account balances of our executive officers’ deferred compensation plan accounts, qualified and excess defined benefit pension plans and qualified defined contribution (401(k)) plan would be made under the distribution provisions of those plans.
Payments Upon Termination for Cause or Voluntary Termination
Our executive officers receive the payments described above under “Payments Made Upon All Terminations.” No additional or enhanced payments would be made to an executive officer.officer for termination for cause or voluntary separation.
| Benefit or Payment | Termination for Cause Voluntary | Termination Death, Disability or Retirement (age 65) (1)(2) | Termination Retirement | Involuntary Termination (3) / Termination | Termination following a | |||||
| Severance (Cash) | None | None | None | Chief Executive Officer Only: a) an amount equal to (i) two times annual base salary at the rate in effect on the date of termination, plus (ii) an amount equal to two times the greater of: (x) ninety percent (90%) of annual base salary, or (y) target annual cash incentive payout payable in the fiscal year in which a termination occurs; and (b) a pro-rated amount of annual cash incentive for such fiscal year based upon actual performance in such fiscal year, as determined at the end of the applicable performance period. | Lump sum cash payment equal to two times the sum of the executive officer’s annual base salary and annual cash incentive compensation (at target payout) | |||||
| Stock Options (Unvested) | Forfeited | • Death or Disability: full vesting (6) • Retirement at 65: vesting continues | Vesting Continues (7) | Forfeited | Vest Upon A Change-in-Control | |||||
6871
| Benefit or Payment |
for Cause Voluntary | Termination Death, Disability or Retirement (age 65) (1)(2) | Termination Retirement | Involuntary Termination (3) / Termination | Termination following a | |||||
| Restricted shares (Unvested) | Forfeited | Full vesting | Pro-rated vesting based on number of months of service since grant date | Chief Executive Officer Only: Full vesting. All others: Forfeited | Vest Upon A Change-in-Control | |||||
| Performance Share Program | Forfeited | Pro-rated payout determined at the conclusion of the respective performance period | Pro-rated payout determined at the conclusion of the respective performance period | Forfeited | Accelerated vesting with payout based on performance at target as of the date of change-in-control | |||||
| Excess Defined Pension Benefit | No enhancement | No enhancement | No enhancement | No enhancement | Two (2) additional years of age and benefit service | |||||
| Paid Health Care Benefits | No | No | No | No | Yes | |||||
| Professional Outplacement Services | No | No | No | No | Yes (up to $50,000) | |||||
| Excise and Related Income Tax Gross Up | No | No | No | No | Yes | |||||
a death benefit that includes amounts provided by us as an insurance benefit in the event of the employee’s death available to all U.S.-based salaried employees and additional amounts elected and paid for by each executive officer who has elected optional insurance coverage; and
| (1) | The disability benefit payable under the long-term disability plan is funded through a group life insurance policy. Any amounts due to an executive officer above the maximum disability payment provided by the long-term disability policy ($25,000 per month) would be paid from our general assets. |
pro-rated payouts for the 2010-2012 and 2011-2013 Long-Term Incentive Plan performance periods. Payouts would be determined at the conclusion of the respective performance period.
| (2) | Predicated upon retirement under the Company-sponsored pension plan. However, in the event of retirement, stock option and restricted share grants made less than 12 months prior to date of termination of employment are forfeited. |
pro-rata payout of unvested restricted shares based on months of service since the grant date.
Payments Upon Termination Due to Long-Term Disability
Our executive officers will receive all the payments described above in the “Payments Made Upon All Terminations” and the following:
| (3) | Presumes involuntary termination was not due to a violation of the Company’s Code of Ethics and Business Conduct. |
monthly income replacement benefits (60% of base salary up to age 65) under a long-term disability plan available to all U.S.-based salaried employees;
24 months of health care coverage based on the COBRA rates applicable to an executive officer; and
pro-rated payouts for the 2010-2012 and 2011-2013 Long-Term Incentive Plan performance periods. Payouts would be determined at the conclusion of the respective performance period.
pro-rata payout of unvested restricted shares based on months of service since the grant date.
The disability benefit payable under the long-term disability plan is funded through a group life insurance policy. Any amounts due to an executive officer above the maximum disability payment provided by the long-term disability policy ($25,000 per month) would be paid from our general assets.
Payments Upon Termination Due to Retirement at Normal Retirement Age
Upon retirement, our named executive officers will receive the payments described above under “Payments Made Upon All Terminations” and the following:
pro-rated payouts for the 2010-2012 and 2011-2013 Long-Term Incentive Plan performance periods. Payouts would be determined at the conclusion of the respective performance period.
payout of all unvested restricted shares.
Payments Upon Termination Without Cause or for Good Reason
If we terminate an executive officer’s employment without cause, an executive officer will receive the payments described above under “Payments Made Upon All Terminations.” We have no contractual obligation to provide severance payments or benefits to an executive officer whose employment is terminated without cause, other than with respect to Mr. Hilton under his employment agreement, and for all executive officers in the event we terminate the executive officer’s employment without cause or the executive officer initiates the termination for good reason following a change-in-control. The terms cash and amount of the severance payment due Mr. Hilton in the event of a termination without cause or a resignation for good reason are discussed under the caption “Severance Agreements” in the Compensation Discussion and Analysis of this Proxy Statement.
| (4) | We have no contractual obligation to provide severance payments or benefits to an executive officer whose employment is terminated without cause, other than with respect to Mr. Hilton under his employment agreement. Severance benefits due Mr. Hilton in the event of a termination without cause or a resignation for good reason are discussed under the caption “Severance Agreements” in the Compensation Discussion and Analysis of this Proxy Statement. |
If any negotiated severance arrangement were entered into between us and an executive officer for severance payments, we would require the executive officer to sign a general release and waiver of claims against us and would typically require compliance with confidentiality and non-compete restrictions. Any agreed-upon severance payment will be subject to delay in the commencement of payments required by Section 409A of the Internal Revenue Code.
“Cause” and “Good Reason” are discussed in the “Severance Agreement” section of the Compensation Discussion and Analysis section of this Proxy Statement.
69
Payments in Connection with a Termination following a Change-in-Control
A change-in-control occurs if and when:
| (5) | A change-in-control occurs if and when: |
subjecta report is filed with the SEC on Schedule 13D or Schedule 14D-1 (or any successor schedule, form, or report), each as promulgated pursuant to certain exceptions,the Exchange Act, disclosing that any “person” (as suchthe term “person” is used in SectionsSection 13(d)(3) and or Section 14(d)(2) of the Securities Exchange Act of 1934)Act) is or becomes a beneficial owner, directly or indirectly, of securities representing 25%35% or more of the combined voting power of our then outstanding securities eligible to vote for the election of the Board of Directors;
during any period of 24 consecutive months, individuals who, at the beginning of such 24-month period were our directors, which we refer to as the incumbent board, cease to constitute at least a majority of the Board of Directors, unless the election, or nomination for election, of any person becoming a director subsequent to the beginning of such 24-month period was approved by a vote of at least two-thirds of the incumbent board;
our shareholders approve a plan of complete liquidation or dissolution;
all or substantially all of our assets are sold in a single transaction or a series of related transactions to a single purchaser or a group of affiliated purchasers; or
72
we are merged or consolidated with another corporation and, as a result, securities representing less than 50% of the combined voting power of the surviving or resulting corporation’s securities (or of the securities of a parent corporation in case of a merger in which the surviving or resulting corporation becomes a wholly-owned subsidiary of the parent corporation) are owned in the aggregate by holders of our securities immediately prior to such merger or consolidation.
A change-in-control results in the vesting of all equity grants which are not vested at the date of a change-in-control:
unvested stock options;
unvested restricted shares; and
unvested long-term performance plan performance share units based on the level of performance achieved as of the date of a change-in control.
The retention agreements in effect on October 31, 2011 and discussed in Part II of the Compensation Discussion and Analysis section of this Proxy Statement under the caption “Change-in-Control Agreements” require two triggering events before any severance payments are made to an executive officer:
Upon a change-in-control, (as defined above); and
subsequent termination ofall outstanding equity compensation awards vest immediately. Unlike the executive officer’s employment without cause by the Company or by the executive officer for good reason.
Each retention agreement provides that, if the employment of the executive officer is terminated during the two years following a change-in-control without “cause” or by the executive officer for “good reason” (as described below), the executive officer receives the following payments and benefits in addition to those payments described“double trigger” discussed above, under “Payments Made Upon All Terminations:”
lump sum cash payment equal to two times the sum of the executive officer’s annual base salary and annual cash incentive compensation (at the target payout);
continuation of welfare benefits (e.g., medical, life insurance, disability coverage) for up to two years;
up to $50,000 of professional outplacement services;
two additional years of age and two additional years of service credit under the Defined Benefit Pension Plan and Excess Defined Benefit Pension Plan; and
70
if applicable, a payment to offset the effect, if any, of the excise tax imposed by the Internal Revenue Code on such severance payments.
“Cause” is defined as (i) the executive officer committing an act of fraud, embezzlement, theft, or other similar criminal act constituting a felony and involving our business, or (ii) except by reason of incurring a disability, the executive officer breaches his agreement to devote his business time, energy, and talent to the business of and to the furtherance of the purposes and objectives of the Company to generally the same extent as the executive officer so devoted his business time, energy, and talent before the change-in-control and fails to cure that breach within 30 days of receipt of written notice of that breach from our Board of Directors.
“Good reason” forno termination of employment initiatedis required for the accelerated vesting of the awards. This “single-trigger” vesting provides our named executive officers with the same opportunity as our shareholders to realize the value created by the executive officer is defined as any of the following circumstances occurring during the two-year period following a change-in-control without the executive officer’s express written consent:transaction.
| (6) |
| (7) |
Payments and Benefits Assuming Termination as of October 31, 2013
The following tables reflect the estimated dollar value of severance; vested but unexercised stock options; accelerated unvested share awards; deferred compensation plan account balances; in-process long-term incentive plan performance share unit awards; excess pension benefits; health care continuation; outplacement benefits; and gross-up of taxes levied on severance payments in each of the following scenarios: voluntary separation; death, long-term disability or retirement; termination by the Company without cause; and termination following a change-in-control. With the assumption that a change-in-control and termination occur simultaneously on the same day — October 31, 2011, we have includedtable reflects the estimated value of accelerated unvested equity in the “Termination After a Change-in-Control” column. The actual amountsenhanced payments and benefits that would be paid to the named executive officers would receive under each scenario can only be determined atvarious termination scenarios assuming that termination occurred as of the actual timelast business day of termination.fiscal year 2013 – October 31, 2013.
In estimating the amounts reflected in the following tables,table, we also used the following general assumptions and principles:
no amounts for 20112013 base salary or payouts under the Annual Cash Incentive Plan and Fiscal Year 2009-20112011-2013 Long-Term Incentive Plan are included in the following tables because the amounts are already earned as of October 31, 20112013 and are not enhanced by any of the triggering events;
amounts were calculated based on each named executive officer’s age, compensation and years of service as of October 31, 2011;2013;
71
the value of our common shares on October 31, 20112013 was $46.37$72.09 per share;
unvested stock options that vest upon a change-in-control were valued at an amount per share equal to the difference between $46.37$72.09 and the grant price per share for each of the stock options;
no amounts were included for account balances in our qualified defined contribution 401(k) plan because this plan is available to all U.S.-based salaried employees who have worked the minimum amount of hours required to receive this benefit;
no amounts were included for balances in named executive officers’ deferred compensation account. Fiscal year-end deferred account balances are reported in the Non-Qualified Deferred Compensation table.
the value of benefits and payments that are generally available to all employees on a non-discriminatory basis are not included;
��
the value of the Long-Term Incentive Plan performance share units for termination other than voluntary termination or termination due to death, disability and retirement at or after normal retirement agecause was determined using payout at target performance;
the total value of accelerated unvested restricted and/or performance shares is based on shares outstanding as of October 31, 20112013 as shown in the “OutstandingOutstanding Equity Awards at Fiscal Year End 2011” table. Value is determined by multiplying the number of shares by the closing price of our common shares on October 31, 2011;2013;
none of the named executive officers is qualified to receive a pension benefit as of October 31, 2011.2013. The actuarial present value of the deferred vested benefit under our Salaried Employees Pension Plan for each named executive officer may be found in the “PensionPension Benefits for Fiscal Year 2011” table; and
calculation of post-termination payout of the Excess Defined Benefit Pension Plan assumes a lump sum payout. Other assumptions used in the calculation are noted in footnote 2 to the “PensionPension Benefits for Fiscal Year 2011” table. The payout amount in the event of a qualifying termination following a change-in-control reflects an additional two years of age and two years of service.
| Voluntary Separation | Death, Long-Term Disability, or Retirement | Termination without Cause or for Good Reason (1) | Termination after a Change-in- Control | |||||||||||||
Michael F. Hilton | ||||||||||||||||
Severance (Cash) | — | — | 2,800,000 | (1) | 2,800,000 | |||||||||||
Stock Options (Vested but not exercised) | 271,154 | 271,154 | 271,154 | 271,154 | ||||||||||||
Stock Options (Unvested) | — | — | — | 965,992 | ||||||||||||
Restricted Stock (Unvested) | — | 665,039 | 317,264 | 734,594 | ||||||||||||
Deferred Compensation | 140,097 | 140,097 | 140,097 | 140,097 | ||||||||||||
Long-Term Incentive Plan Awards: | ||||||||||||||||
FY2010-2012 | — | 755,336 | 755,336 | 1,133,005 | ||||||||||||
FY2011-2013 | — | 278,220 | 278,220 | 834,660 | ||||||||||||
Excess Defined Pension Benefit | 441,956 | 441,856 | 441,856 | 1,046,293 | ||||||||||||
Health Care Benefits | — | — | — | 22,876 | ||||||||||||
Professional Outplacement Services | — | — | — | 50,000 | ||||||||||||
Excise and Related Income Tax Gross Up | — | — | — | 3,368,253 | ||||||||||||
Total Payments or Benefits | 853,107 | 2,551,702 | 5,003,927 | 11,366,923 | ||||||||||||
73
Although the calculations are intended to provide reasonable estimates of the potential benefits, they are based on numerous assumptions and may not represent the actual amount a named executive officer would receive if an eligible termination event were to occur. The actual amounts that would be paid to the named executive officers under each scenario can only be determined at the actual time of termination.
| Death, Disability Retirement (At Normal Age 65) ($) | Early Retirement (Age 55) ($) | Involuntary Termination/ Termination Without Cause or for Good Reason (1) ($) | Qualifying Termination Following Change- in-Control ($) | |||||||||||||
Michael F. Hilton | 5,676,148 | 2,353,130 | 1,273,614 | 22,429,312 | ||||||||||||
Gregory A. Thaxton | 1,341,827 | 545,557 | — | 7,587,313 | ||||||||||||
John J. Keane | 1,724,273 | 699,272 | — | 9,224,049 | ||||||||||||
Peter G. Lambert | 1,126,094 | 462,335 | — | 5,165,438 | ||||||||||||
Gregory P. Merk | 1,023,869 | 435,902 | — | 5,376,091 | ||||||||||||
| (1) |
72
| Voluntary Separation | Death, Long-Term Disability, or Retirement | Termination without Cause | Termination after a Change-in- Control | |||||||||||||
Gregory A. Thaxton | ||||||||||||||||
Severance (Cash) | — | — | — | 1,056,000 | ||||||||||||
Stock Options (Vested but not exercised) | 67,694 | 67,694 | 67,694 | 67,694 | ||||||||||||
Stock Options (Unvested) | — | — | — | 736,652 | ||||||||||||
Restricted Stock (Unvested) | — | 213,333 | 136,050 | 228,790 | ||||||||||||
Deferred Compensation | 374,533 | 374,533 | 374,533 | 374,533 | ||||||||||||
Long-Term Incentive Plan Awards: | ||||||||||||||||
FY2010-2012 | — | 185,480 | 185,480 | 278,220 | ||||||||||||
FY2011-2013 | — | 61,827 | 61,827 | 185,480 | ||||||||||||
Excess Defined Pension Benefit | 595,147 | 595,147 | 595,147 | 772,258 | ||||||||||||
Health Care Benefits | — | — | — | 23,373 | ||||||||||||
Professional Outplacement Services | — | — | — | 50,000 | ||||||||||||
Excise and Related Income Tax Gross Up | — | — | — | 1,450,421 | ||||||||||||
Total Payments or Benefits | 1,037,394 | 1,498,014 | 1,420,730 | 5,223,421 | ||||||||||||
| Voluntary Separation | Death, Long-Term Disability, or Retirement | Termination without Cause | Termination after a Change-in- Control | |||||||||||||
John J. Keane | ||||||||||||||||
Severance (Cash) | — | — | — | 1,122,000 | ||||||||||||
Stock Options (Vested but not exercised) | 839,149 | 839,149 | 839,149 | 839,149 | ||||||||||||
Stock Options (Unvested) | — | — | — | 1,250,826 | ||||||||||||
Restricted Stock (Unvested) | — | 386,417 | 278,220 | 408,056 | ||||||||||||
Deferred Compensation | 1,133,122 | 1,133,122 | 1,133,122 | 1,133,122 | ||||||||||||
Long-Term Incentive Plan Awards: | ||||||||||||||||
FY2010-2012 | 0 | 247,307 | 247,307 | 370,960 | ||||||||||||
FY2011-2013 | 0 | 86,557 | 86,557 | 259,672 | ||||||||||||
Excess Defined Pension Benefit | 1,806,060 | 1,086,060 | 1,086,060 | 1,339,836 | ||||||||||||
Health Care Benefits | — | — | — | 23,373 | ||||||||||||
Professional Outplacement Services | — | — | — | 50,000 | ||||||||||||
Excise and Related Income Tax Gross Up | — | — | — | 2,738,971 | ||||||||||||
Total Payments or Benefits | 3,058,331 | 3,778,612 | 3,670,415 | 9,535,965 | ||||||||||||
73
| Voluntary Separation | Death, Long-Term Disability, or Retirement | Termination without Cause | Termination after a Change-in- Control | |||||||||||||
Peter G. Lambert | ||||||||||||||||
Severance (Cash) | — | — | — | 912,000 | ||||||||||||
Stock Options (Vested but not exercised) | — | — | — | — | ||||||||||||
Stock Options (Unvested) | — | — | — | 654,013 | ||||||||||||
Restricted Stock (Unvested) | — | 193,270 | 123,715 | 207,181 | ||||||||||||
Deferred Compensation | 36,176 | 36,176 | 36,176 | 36,176 | ||||||||||||
Long-Term Incentive Plan Awards: | ||||||||||||||||
FY2010-2012 | — | 145,293 | 145,293 | 217,939 | ||||||||||||
FY2011-2013 | — | 58,735 | 58,735 | 176,206 | ||||||||||||
Excess Defined Pension Benefit | 544,000 | 544,000 | 544,000 | 717,015 | ||||||||||||
Health Care Benefits | — | — | — | 16,026 | ||||||||||||
Professional Outplacement Services | — | — | — | 50,000 | ||||||||||||
Excise and Related Income Tax Gross Up | — | — | — | 966,351 | ||||||||||||
Total Payments or Benefits | 580,176 | 977,474 | 907,919 | 3,952,907 | ||||||||||||
| Voluntary Separation | Death, Long-Term Disability, or Retirement | Termination without Cause | Termination after a Change-in- Control | |||||||||||||
Douglas C. Bloomfield | ||||||||||||||||
Severance (Cash) | — | — | — | 775,000 | ||||||||||||
Stock Options (Vested but not exercised) | 626,168 | 626,168 | 626,168 | 626,168 | ||||||||||||
Stock Options (Unvested) | — | — | — | 636,021 | ||||||||||||
Restricted Stock (Unvested) | — | 173,115 | 111,288 | 185,480 | ||||||||||||
Deferred Compensation | 1,126,267 | 1,126,267 | 1,126,267 | 1,126,267 | ||||||||||||
Long-Term Incentive Plan Awards: | ||||||||||||||||
FY2010-2012 | — | 129,836 | 129,836 | 194,754 | ||||||||||||
FY2011-2013 | — | 49,461 | 49,461 | 148,384 | ||||||||||||
Excess Defined Pension Benefit | 634,305 | 634,305 | 634,305 | 821,606 | ||||||||||||
Health Care Benefits | — | — | — | 23,373 | ||||||||||||
Professional Outplacement Services | — | — | — | 50,000 | ||||||||||||
Excise and Related Income Tax Gross Up | — | — | — | 2,097,871 | ||||||||||||
Total Payments or Benefits | 2,386,740 | 2,739,152 | 2,677,325 | 6,684,924 | ||||||||||||
74
January 23, 201217, 2014
To: The Board of Directors of Nordson Corporation
OurThe Audit Committee has reviewed and discussed with management the audited financial statements of the Company for the year ended October 31, 20112013 (the “Audited Financial Statements”). In addition, we have discussed with Ernst & Young LLP (“E&Y”), the principal independent registered public accounting firm for the Company, the matters required by Codification of Statements on Auditing StandardsStandard No. 61, as amended, as adopted by the Public Accounting Oversight Board in Rule 3200T.Board.
The Committee also has received the written disclosures and the letter from E&Y required by Rule 3526 of the Public Company Accounting Oversight Board regarding the independent accountant’s communications with the audit committee concerning independence. We have discussed with E&Y its independence from management and the Company, including the compatibility of non-audit services with E&Y’s independence.
Based on the foregoing review and discussions and relying thereon, we have recommended to our Board of Directors the inclusion of the Audited Financial Statements in our Annual Report onForm 10-K for the year ended October 31, 2011.2013.
This Audit Committee report shall not be deemed incorporated by reference by any general statement incorporating by reference this Proxy Statement into any filing under the Securities Act of 1933 (the “Securities Act”) or the Securities Exchange Act of 1934 (the “Exchange Act”), except to the extent that we specifically incorporate this information by reference, and shall not otherwise be deemed filed under the Exchange Act.
This report has been furnished by the members of the Audit Committee:
Michael J. Merriman, Jr., Chairman
Randolph W. Carson
Dr. David W. IgnatArthur L. George, Jr.
Victor L. Richey, Jr.Frank M. Jaehnert
YOUR VOTE IS IMPORTANT. PLEASE VOTE YOUR PROXY ACCORDING TO THE INSTRUCTIONS ON THE |
NORDSON CORPORATION 28601 CLEMENS ROAD WESTLAKE, OH 44145-1119 | VOTE BY INTERNET -www.proxyvote.com
Use the Internet to transmit your voting instructions and for electronic delivery of information up until 11:59 P.M. Eastern Time the day before the cut-off date or meeting date. Have your proxy card in hand when you access the web site and follow the instructions to obtain your records and to create an electronic voting instruction form.
ELECTRONIC DELIVERY OF FUTURE PROXY MATERIALS
If you would like to reduce the costs incurred by our company in mailing proxy materials, you can consent to receiving all future proxy statements, proxy cards and annual reports electronically via e-mail or the Internet. To sign up for electronic delivery, please follow the instructions above to vote using the Internet and, when prompted, indicate that you agree to receive or access proxy materials electronically in future years.
VOTE BY PHONE - 1-800-690-6903
Use any touch-tone telephone to transmit your voting instructions up
VOTE BY MAIL
Mark, sign and date your proxy card and return it in the postage-paid envelope we have provided or return it to Vote Processing, c/o Broadridge, 51 Mercedes Way, Edgewood, NY 11717. If you vote by mail, your proxy card must be received no later than 11:59 P.M. Eastern Standard Time, the day before the cut-off date. |
TO VOTE, MARK BLOCKS BELOW IN BLUE OR BLACK INK AS FOLLOWS:
M39618-Z56791 KEEP THIS PORTION FOR YOUR RECORDS
M64916-P45529-Z62137 | KEEP THIS PORTION FOR YOUR RECORDS |
— — — — — — — — — — — — — — — — — — — — — — — — — — — — — — — — — — — — — — — — — — — —
DETACH AND RETURN THIS PORTION ONLY
THIS PROXY CARD IS VALID ONLY WHEN SIGNED AND DATED.
NORDSON CORPORATION | For
| Withhold All | For Except | To withhold authority to vote for any individual | |||||||||||||||||||||||||||||
The Board of Directors recommends you vote FOR Proposals 1, 2 and 3: | |||||||||||||||||||||||||||||||||
Proposal 1. | Election of Directors |
| ¨ | ¨ |
|
|
| ||||||||||||||||||||||||||
Nominees: | |||||||||||||||||||||||||||||||||
01) Joseph P. Keithley | �� | ||||||||||||||||||||||||||||||||
| |||||||||||||||||||||||||||||||||
03) Mary G. Puma | |||||||||||||||||||||||||||||||||
| For | Against | Abstain | |||||||||||||||||||||||||||||||
| Ratify the appointment of Ernst & Young LLP as our independent registered public accounting firm for the fiscal yearending October 31, 2014. | ¨ | ¨ | ¨ | |||||||||||||||||||||||||||||
Proposal 3. | Advisory vote to approve named executive officer compensation. | ¨ | ¨ | ¨ | |||||||||||||||||||||||||||||
NOTE:Such other business as may properly come before the meeting or any adjournment thereof. | |||||||||||||||||||||||||||||||||
| |||||||||||||||||||||||||||||||||
| |||||||||||||||||||||||||||||||||
| |||||||||||||||||||||||||||||||||
| |||||||||||||||||||||||||||||||||
| |||||||||||||||||||||||||||||||||
| |||||||||||||||||||||||||||||||||
| |||||||||||||||||||||||||||||||||
| Please sign exactly as your name(s) appear(s) hereon. When signing as attorney, executor, administrator, or other fiduciary, please give full title as such. Joint owners should each sign personally. All holders must sign. If a corporation or partnership, please sign in full corporate or partnership name by authorized officer. | |||||||||||||||||||||||||||||||||
Signature [PLEASE SIGN WITHIN BOX] | Date | Signature (Joint Owners) | ||||||||||||||||||||||||||||
Date | ||||||||||||||||||||||||||||||
Important Notice Regarding the Availability of Proxy Materials for the Annual Meeting:
The Notice and Proxy Statement, Annual Report and Shareholder Letter are available at www.proxyvote.com.
— — — — — — — — — — — — — — — — — — — — — — — — — — — — — — — — — — — — — — — — — —
M39619-Z56791
NORDSON CORPORATION
Annual Meeting of Shareholders
February 28, 2012 8:30 a.m.
This proxy is solicited by the Board of Directors
The shareholder(s) hereby appoint(s) Lee C. Banks, Randolph W. Carson and Victor L. Richey, Jr. or any of them, as proxies, each with the power to appoint (his/her) substitute, and hereby authorizes them to represent and to vote, as designated on the reverse side of this ballot, all of the shares of Common stock of NORDSON CORPORATION that the shareholder(s) or Plan Participants is/are entitled to vote at the Annual Meeting of Shareholders at the Atlanta Marriott Alpharetta, 5750 Windward Parkway, Alpharetta, Georgia 30005.
This proxy, when properly executed, will be voted in the manner directed herein. If no such direction is made, this proxy will be voted in accordance with the Board of Directors’ recommendations.
In order to ensure that your securities are voted as you wish, if you are a shareholder of record, the proxy must be voted by 11:59 P.M. Eastern Standard Time, February 27, 2012.M64917-P45529-Z62137
NORDSON CORPORATION Annual Meeting of Shareholders February 25, 2014 This proxy is solicited by the Board of Directors The shareholder(s) hereby appoint(s) Arthur L. George, Jr. and Frank M. Jaehnert or any of them, as proxies, each with the power to appoint (his/her) substitute, and hereby authorize(s) them to represent and to vote, as designated on the reverse side of this ballot, all of the shares of Common Stock of NORDSON CORPORATION that the shareholder(s) or Plan Participant(s) is/are entitled to vote at the Annual Meeting of Shareholders, or any postponement or adjournment thereof, at Nordson Corporation, 28601 Clemens Rd., Westlake, OH 44145 and at their discretion to cumulate votes in the election of directors if cumulative voting is invoked by a shareholder through proper notice to Nordson Corporation. This proxy, when properly executed, will be voted in the manner directed herein. If no such direction is made, this proxy will be voted in accordance with the Board of Directors’ recommendations. If cumulative voting is invoked, by a shareholder through proper notice to Nordson Corporation, this proxy will give the proxy holders authority, in their discretion, to cumulate all votes to which the shareholder is entitled with respect to the shares represented by this proxy and allocate them in favor of one or more of the nominees for director if any situation arises, which in the opinion of the proxy holders, makes such action necessary or desirable. In order to ensure that your securities are voted as you wish, if you are a shareholder of record, the proxy must be voted by 11:59 P.M., Eastern Standard Time, on February 24, 2014. | ||||||||
IMPORTANT NOTICE TO PARTICIPANTS IN THE EMPLOYEES’ SAVINGS TRUST PLAN AND EMPLOYEE STOCK OWNERSHIP PLAN (COLLECTIVELY, THE “PLANS”).
New York Life Trust Company, as Trustee of the
For this meeting, the | ||||||||
Continued and to be signed on reverse side | ||||||||
Continued and to be signed on reverse side